Table of Contents
HWMonitor can display temperature sensors for the CPU, graphics processor, storage devices, motherboard, and some memory modules. The available rows depend on the hardware: if a device has no exposed thermal sensor, HWMonitor cannot invent one. Use the exact component model and the manufacturer's specification to interpret each reading.
Set up HWMonitor
Download the installer or portable build from CPUID's official HWMonitor page. Avoid third-party download bundles. Open the program and wait for the device tree to populate; expand a device by selecting the arrow or plus icon beside its name.
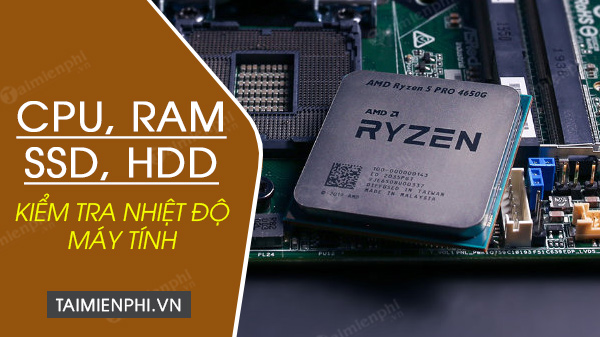
Each sensor normally has three columns:
- Value: the current reading.
- Min: the lowest value observed since HWMonitor opened.
- Max: the highest value observed during the session.
For a meaningful check, record an idle baseline, run the workload that causes concern, then review the Max column. A single screenshot at idle cannot show how the cooling system behaves during a game, render, file transfer, or stress test.
Check CPU temperature
Expand the processor entry, then expand Temperatures. Package is usually the most useful overall CPU reading. Individual Core or CCD sensors provide additional detail where the processor exposes them.
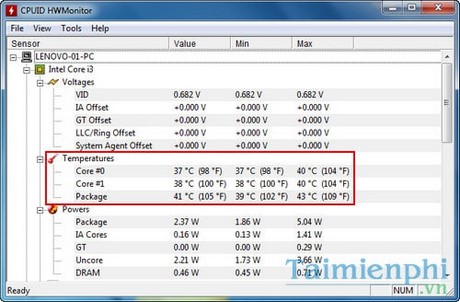
There is no universal rule that every CPU must remain below 70°C. Laptop and desktop processors use different power and cooling designs, and each model has a documented maximum or junction temperature. Compare the same sensor type with the processor manufacturer's limit. Sustained throttling, repeated thermal shutdowns, or a value that approaches the documented limit under an ordinary workload warrants investigation.
For more detail on CPU sensors, follow the HWMonitor CPU temperature guide.
Check SSD or hard-drive temperature
Scroll to the storage device's model name and expand its temperature or S.M.A.R.T. section. NVMe SSDs may expose more than one sensor, such as a composite value and controller or NAND readings. A hard drive may expose a single assembly temperature.
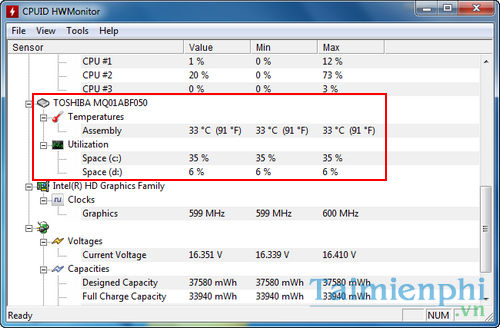
Use the operating range in the drive's data sheet rather than a generic “safe drive temperature.” Also consider the workload: an NVMe controller can warm quickly during a long transfer and cool soon afterward. Back up important data before troubleshooting a drive that also reports S.M.A.R.T. warnings, read errors, or unexpected disconnections.
Check GPU temperature
Expand the AMD, Intel, or NVIDIA graphics adapter. Depending on the card and driver, HWMonitor may show a general GPU temperature plus Hot Spot, memory-junction, or other sensors.
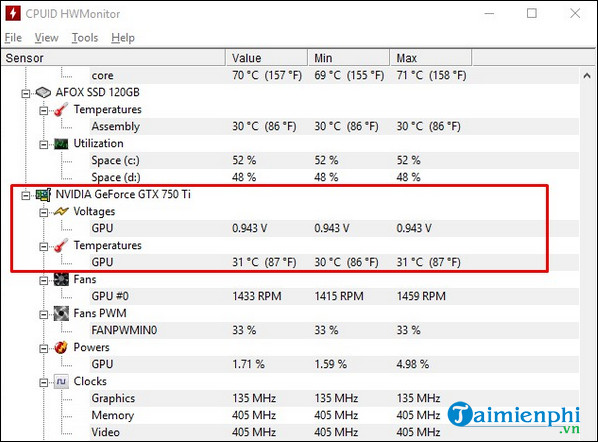
Do not compare a Hot Spot value directly with a general GPU value; they measure different locations and have different limits. Check the exact GPU or board manufacturer's guidance. If temperature rises rapidly while clock speed falls, inspect fan operation, blocked vents, dust, case airflow, and any recent overclock or fan-profile change.
Check RAM temperature when a sensor is available
Some memory modules include thermal sensors and appear as separate devices or DIMM rows. Many ordinary modules do not expose temperature, so a missing RAM reading is normal and does not mean HWMonitor is broken.
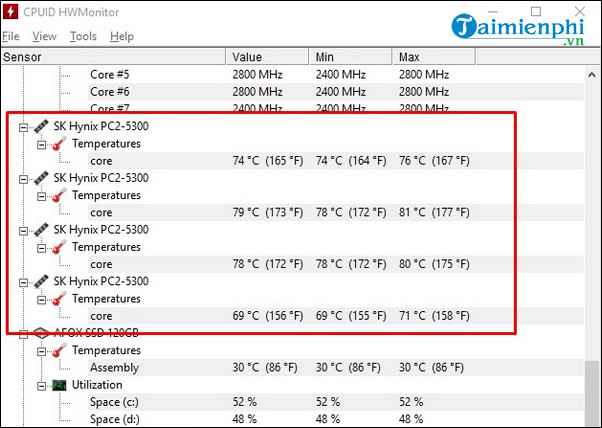
Memory temperature limits depend on the DRAM generation, module design, voltage, error-correcting features, and manufacturer. Do not treat one example reading as a target for all RAM. If errors appear during heavy memory use or after enabling XMP/EXPO, return to default settings and run a proper memory test.
What to do with a suspicious reading
- Confirm the component model and sensor name.
- Compare the result with another reputable monitor or the computer manufacturer's utility.
- Repeat the same workload and record Value, Max, clock speed, utilization, and fan behavior.
- Check the component manufacturer's documented operating limit.
- Return recent overclocks, voltage changes, and custom fan settings to a known-good configuration.
- Power off the computer before cleaning external vents or inspecting cables and fans.
An impossible value, such as a fixed extreme number that never changes, is often an unsupported or mislabeled sensor. Do not dismantle hardware based on one dubious row.
For alternatives and features such as logging or graphs, compare PC temperature-monitoring applications. Good troubleshooting records the exact sensor and workload instead of reducing every component to a single universal temperature threshold.
Related Articles
 5 Ways to Check Hard Drive Effectively to Help Periodically Check11 minutes read
 Check Computer Temperature: CPU, VGA (Video Card), HDD (Hard Drive)3 minutes read
 Hard Drive Check: How to Check Hard Drive Health in 3 Ways4 minutes read
 3 How to Check the Working Status of the Hard Drive4 minutes read
 How to Check the Temperature of CPU, VGA, Hard Drive of Computer6 minutes read
 8 Effective Ways to Check Your Hard Drive to Periodically Check18 minutes read
Reader Comments 0
Sign in with email or Google to join the discussion.