Table of Contents
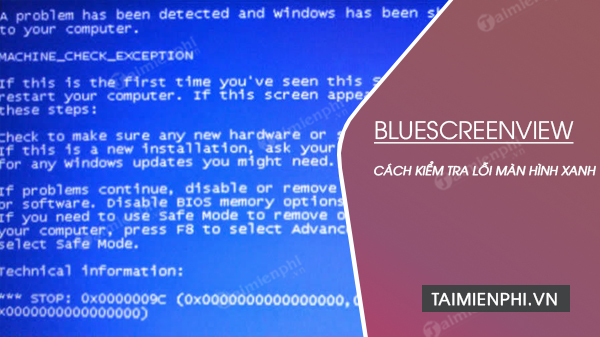
BlueScreenView is a portable Windows utility that lists blue-screen minidump files and extracts each crash's date, stop code, parameters, and loaded modules. It is useful for finding patterns, but a driver highlighted by the program is a clue—not proof that the driver caused the crash. Confirm the evidence before uninstalling software or replacing hardware.
Before you start
- Record the exact stop code and what the PC was doing before it restarted.
- Save important work and back up irreplaceable files if crashes are frequent.
- Download BlueScreenView only from the official NirSoft BlueScreenView page. Choose the build that matches Windows and avoid repackaged download sites.
- Do not run “cleaner” tools that delete dump files before analysis.
BlueScreenView reads crash dumps; it does not prevent crashes or repair Windows by itself.
1. Download and open BlueScreenView
- Download the portable ZIP or installer from NirSoft's page.
- If using the portable build, extract the ZIP to a normal folder. Do not run an executable directly from a compressed archive.
- Open BlueScreenView.exe. Run it as administrator if it cannot read the Windows minidump folder.
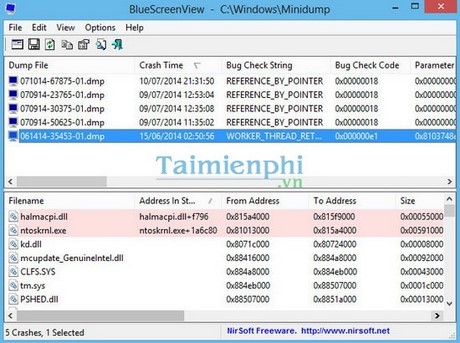
The program normally scans C:WindowsMinidump and shows one row per small memory dump.
2. Read the crash list
Select a dump and review these columns:
| Column | How to use it |
|---|---|
| Crash Time | Match the dump to the restart you experienced. |
| Bug Check String / Bug Check Code | Identifies the Windows stop condition; the code is more dependable than a translated name. |
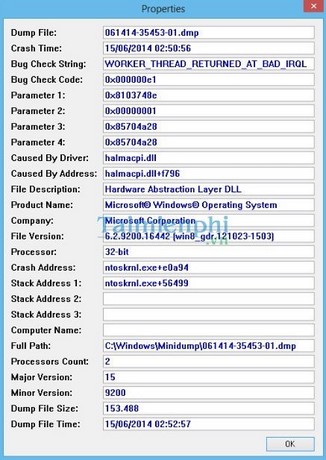
| Parameter 1–4 | Arguments whose meaning depends on the stop code. They are useful when checking Microsoft's bug-check documentation. |
| Caused By Driver / Address | A module associated with the failing stack. Treat it as a lead, not a final diagnosis. |
| Dump File | The file BlueScreenView analyzed, useful when comparing results in WinDbg. |
Right-click a crash and open Properties to view its details in one window.
3. Use the lower pane to inspect modules
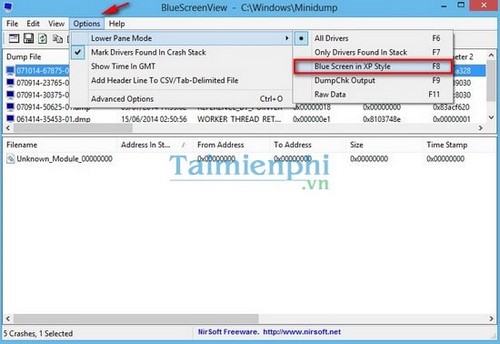
Open Options > Lower Pane Mode. Useful modes include showing all drivers or only drivers found in the crash stack. The older Blue Screen in XP Style view recreates a visual summary, but it does not add diagnostic evidence.
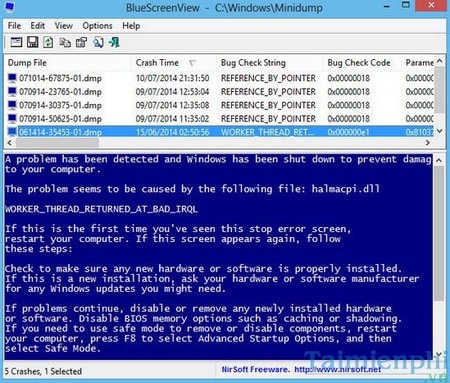
Windows kernel files such as ntoskrnl.exe appear in many crashes because the kernel records and handles the failure. Their presence alone does not mean Windows itself is the root cause. Look for a recurring third-party module across several dumps and correlate it with recent driver, hardware, firmware, or software changes.
4. Research the stop code carefully
BlueScreenView's File menu can search the web for a bug-check code and driver name.
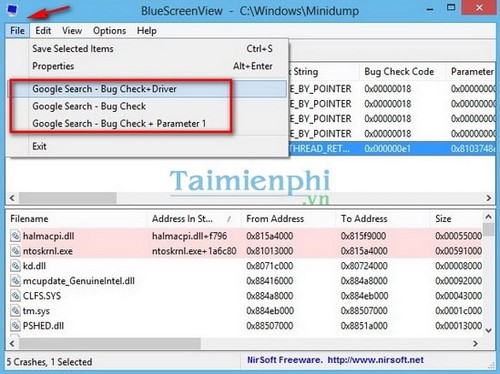
Search the code in hexadecimal form, such as 0x00000133, and include the first parameter when the reference documentation says it changes the meaning. Prefer Microsoft documentation, the PC or component manufacturer's support site, and documentation for the exact driver. A generic search result that blames one file is not enough evidence.
TipsMake's BSOD code lookup provides a quick starting point, while the article on laptop blue-screen causes explains common driver, storage, memory, and overheating checks.
How to interpret the result
- Compare multiple crashes: One dump may be misleading. Repeated stop codes or the same non-Microsoft module are more useful.
- Build a timeline: Note Windows updates, driver installs, new hardware, BIOS changes, overclocking, and crashes under specific workloads.
- Test one hypothesis at a time: Update or roll back the supported driver, remove a recent device, return clocks to default, or run the manufacturer's diagnostic.
- Verify after each change: Do not apply several major fixes simultaneously; you will lose the ability to identify the cause.
If a crash started immediately after a driver update, a supported rollback is usually safer than installing a random older driver from an archive. If storage or memory is suspected, back up data before stress tests and use the device manufacturer's diagnostics.
If BlueScreenView shows no dumps
First confirm that the event was a Windows bug check rather than an abrupt power loss or freeze. An unexpected power cut may leave no useful crash dump.
- Press Windows + R, enter
sysdm.cpl, and press Enter. - Open Advanced > Startup and Recovery > Settings.
- Under Write debugging information, select Small memory dump or the dump type appropriate to your support instructions.
- Confirm the small-dump directory is
%SystemRoot%Minidump. - Keep a Windows-managed paging file on the boot volume and enough free space for the selected dump type.
Changing the setting does not reconstruct old dumps; it affects a future crash. Corporate PCs may enforce a different policy, so contact IT rather than changing it.
Open a dump from another location
To analyze a copied minidump or another Windows installation, use Options > Advanced Options and select the folder containing the .dmp files. Copy protected dumps to a working folder if permissions block access, but keep the originals unchanged.
When to use WinDbg instead
BlueScreenView is designed for fast summaries. Microsoft's WinDbg can load symbols, examine call stacks and objects, and run !analyze -v. Use it when:
- BlueScreenView repeatedly highlights only Windows kernel components;
- the same stop code has several possible causes;
- the crash involves virtualization, storage filters, security software, or a complex driver stack;
- you need evidence suitable for a driver vendor or support engineer.
A small dump contains limited information, so even WinDbg may not identify an indirect cause. A support engineer may request a kernel or active memory dump instead.
Protect sensitive information
Crash dumps can contain memory fragments, device identifiers, file paths, account names, and other private data. Do not upload a dump publicly without understanding what it contains. Share it only with a trusted support channel, use the minimum dump type required, and remove public links after the case is resolved.
What to do after finding a likely cause
Use a supported update, rollback, or configuration change, then monitor whether the pattern returns. Avoid registry “fixes,” driver removals, or firmware updates that are unrelated to the evidence. If Windows enters a restart loop, follow TipsMake's guide to the “Your PC ran into a problem” error and use Safe Mode or recovery options as appropriate.
Related Articles
 What Is Bluescreenview? How Does It Use?5 minutes read
 Ways to Fix BSOD Blue Screen Error19 minutes read
 Prevent 'Blue Screen Errors' on Windows 82 minutes read
 Instructions to Fix Blue Screen Error on Computer15 minutes read
 How to Fix Blue Screen Error on Windows 11, 10, 8, 79 minutes read
 Instructions on How to Fix Blue Screen Errors on Computers9 minutes read
Reader Comments 0
Sign in with email or Google to join the discussion.