Filter duplicate data, delete duplicate data in Excel
For excel files with large log volumes, duplication of data is very common. So I introduce to you how to filter duplicated data with tools available in excel.
For excel files with large volumes of records, duplication of data is very common, and if it is found and processed manually, duplicated data will take a lot of time and effort. So I introduce to you how to filter duplicated data with tools available in excel.
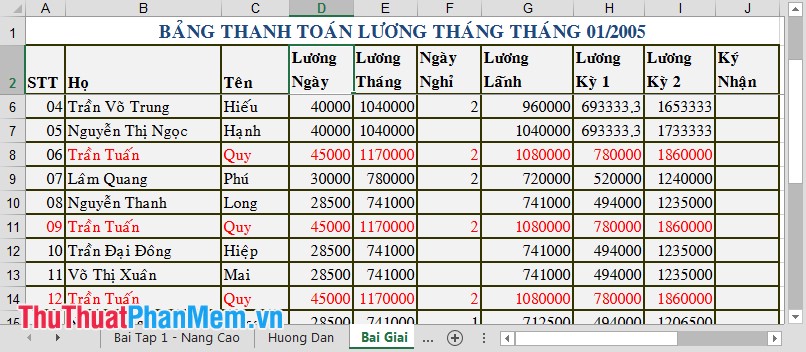
For example, I have the following data table. The red records are marked as duplicates. What you need to do is find duplicate data and keep an original, delete other records.
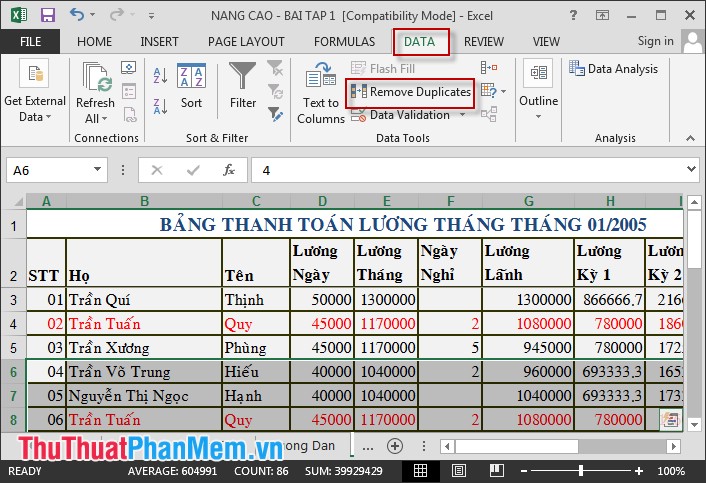
Step 1: Highlight all the data you want to filter Go to Data -> Remove Duplicate .
Step 2: The Remove Duplicate dialog box appears, selectable as follows:
- Filter all fields, click Select All -> OK .

- Filter each field you choose Unselect All -> select the fields you want to filter -> OK .

Step 3: Microsoft Excel dialog box appears -> OK . (The dialog box informs the number of duplicate records, the number of records deleted and the total number of corrections after deletion.)

Data table results after filtering:

Good luck!
Was this article helpful?
Your feedback helps us improve.
Related Articles
 How to remove duplicates in excel5 minutes read
 How to filter duplicate data from 2 Sheets in Excel6 minutes read
 Find and delete duplicate data in Excel6 minutes read
 2 ways to delete data, duplicate content in Excel4 minutes read
 Filter data that doesn't overlap in Excel - Filter for unique values in Excel3 minutes read
 How to Find Duplicate Data in Excel5 minutes read
Reader Comments 0
Sign in with email or Google to join the discussion.