Learn about Chrome: // Chrome page
In the previous article, we introduced you to some of the technical features of Firefox's about page, and this time we will continue to learn about Chrome's similar page system, which is chrome: //
TipsMake.com - In the previous article, we introduced you to some of the technical features of Firefox 's about page , and this time we will continue to learn about the same page system of the browser. Chrome, that's chrome: //
Chrome: // About
In chrome: // about this page contains a lot of URLs that lead to different pages, many of which you can open through Chrome's main menu, such as chrome: // bookmarks is the management page. bookmark, chrome: // settings is Chrome 's corresponding Options page:
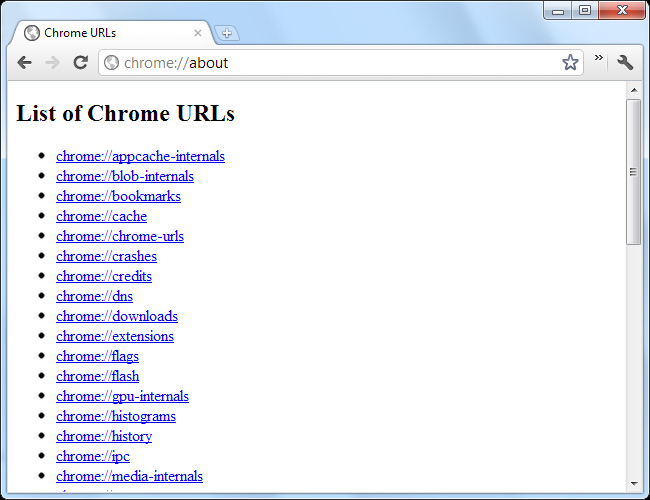
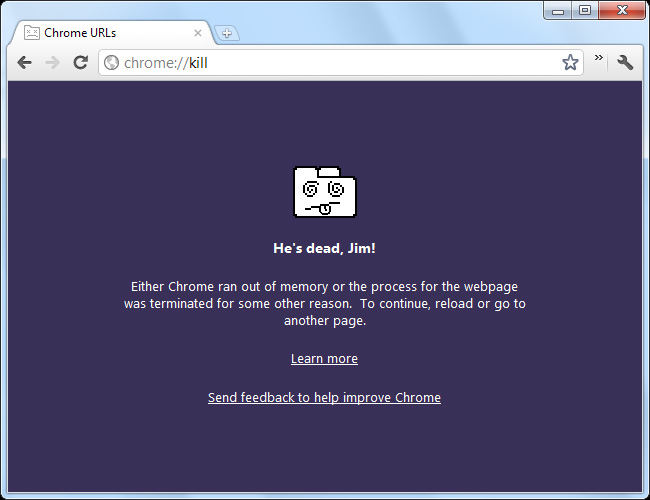
Besides, there are a few special URL paths used for debugging located at the bottom of the page. For example, type chrome: // kill in the Address box to turn off the open tab:
Chrome: Flags
Chrome: // flags , or chrome: // labs pages can be considered the most interesting part of Chrome. Almost all of the features here have not been activated and used in the default mode, and Google also recommends that users be absolutely careful when tampering and editing technical attributes. here. These internal features are related to security, management policies, and stability, but may result in data loss. So consider carefully before deciding to use!

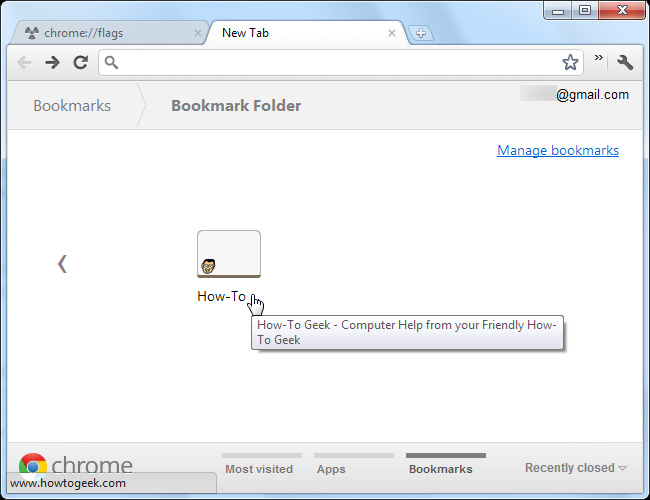
New features are usually enabled here before they are enabled via the default mode. For example, users can enable the Enable NTP Bookmark Features option to add a bookmark section to Chrome's new tab. The new bookmark manager has not been enabled in Chrome 16 yet, but will definitely be changed in subsequent versions.
Chrome: Sessions
Another feature is hidden inside chrome: // flags as Enable Syncing Open Tabs , with the main effect being to add the Open Tabs option in Chrome 's Sync Settings section:
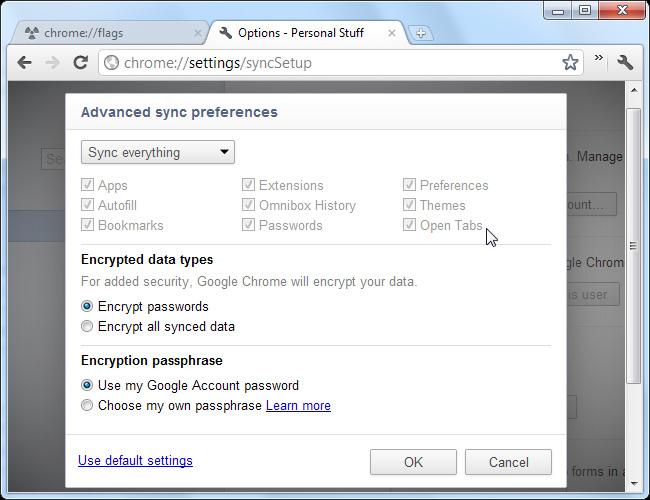
After activation, we will see a list of browser sessions in the chrome: // sessions.
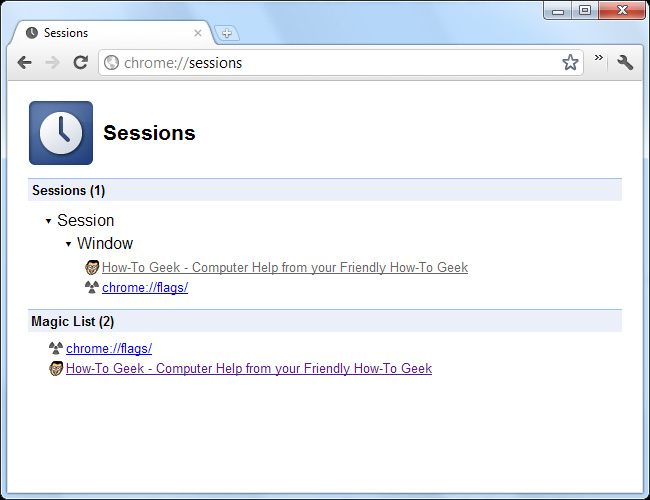
However, this feature is already available in default mode and displayed on Chrome's main interface.
Chrome: // Memory and Chrome: // Tasks
In chrome: // memory , users will know more about Chrome's memory usage information, specifically for the extension and associated applications. In case there are other browsers running, such as Mozilla Firefox or Internet Explorer , it will also display the usage of those browsers.
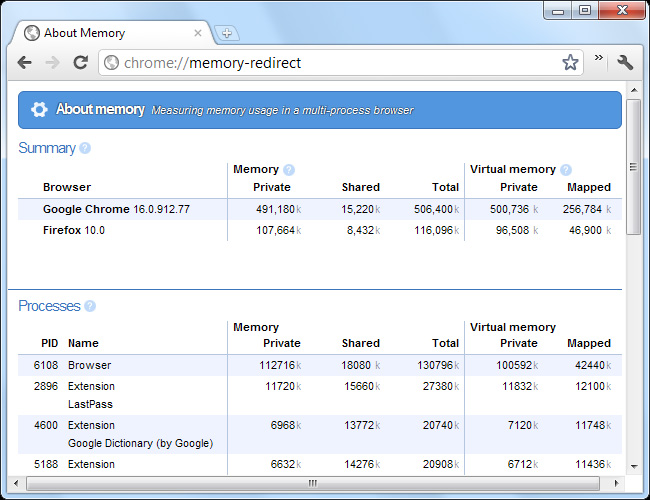
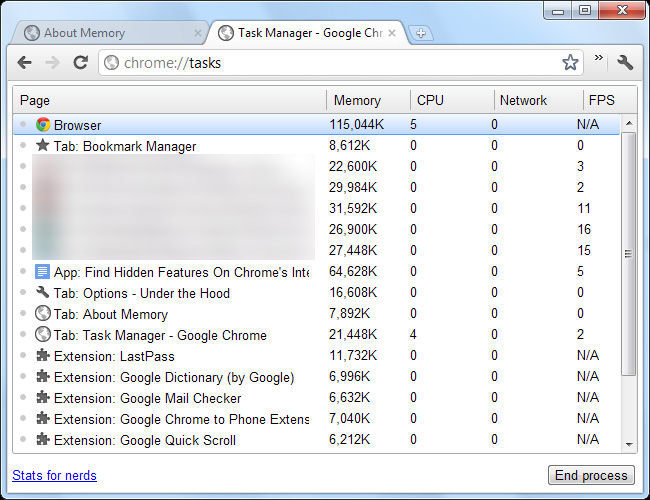
Besides, you can open chrome: // memory page by clicking on the link Stats for nerds at the bottom of the Task Manager window of Chrome, right-click on Chrome's title bar and select Task Manager or type chrome : // tasks into new tab:
Chrome: // Net-Internals
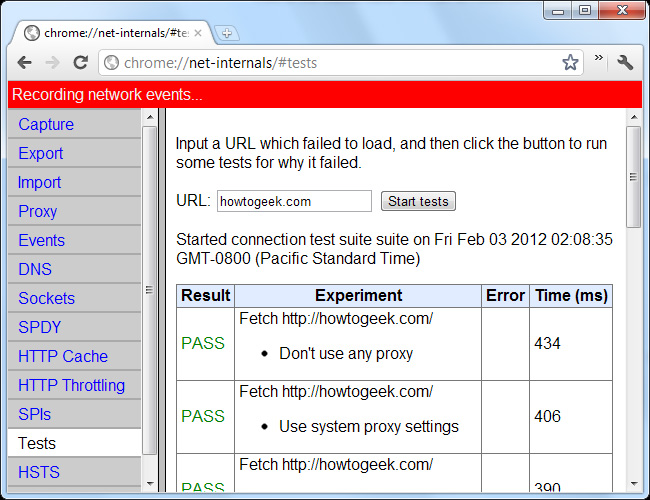
On the other hand, the chrome: // net-internals page will show all the information and tools that support managing, monitoring and diagnosing connection problems. Support the ability to 'capture' network packets, analyze and save reports to files for future use.
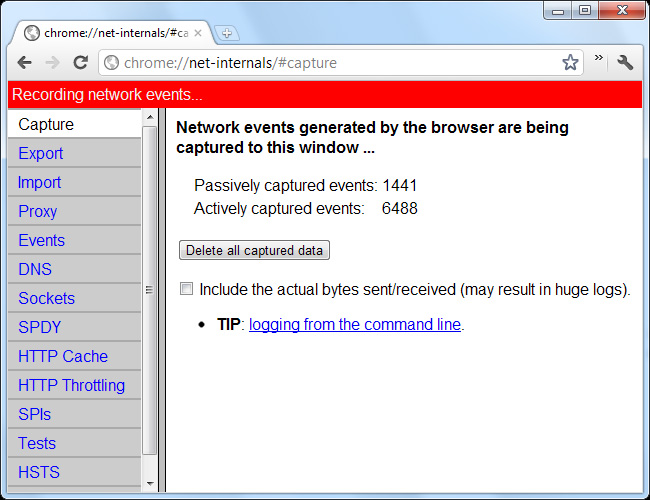
However, most of the tools here are not suitable for normal users, but the Tests section is different. If a website is inaccessible, enter the site's address in the Tests page and Chrome will determine the exact problem for you.
Chrome: // Crashes
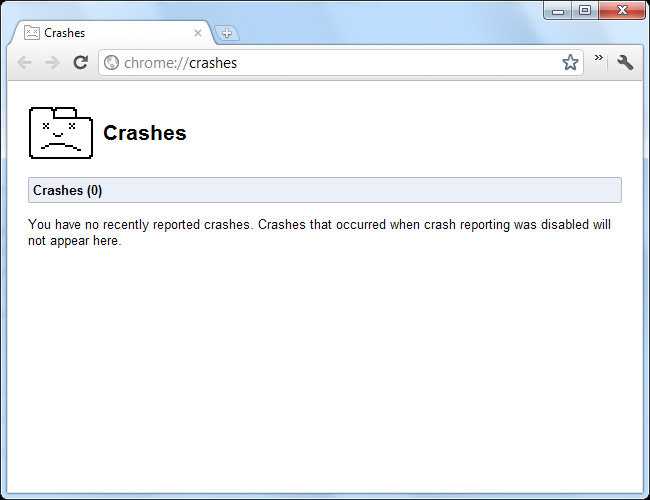
In the chrome: // crashes section , the browser will list all the most recent errors. However, we can only see this error if Automatically send usage statistics and crash reports to Google options are enabled under Under the Hood of Chrome Settings .
Chrome: // Tracing
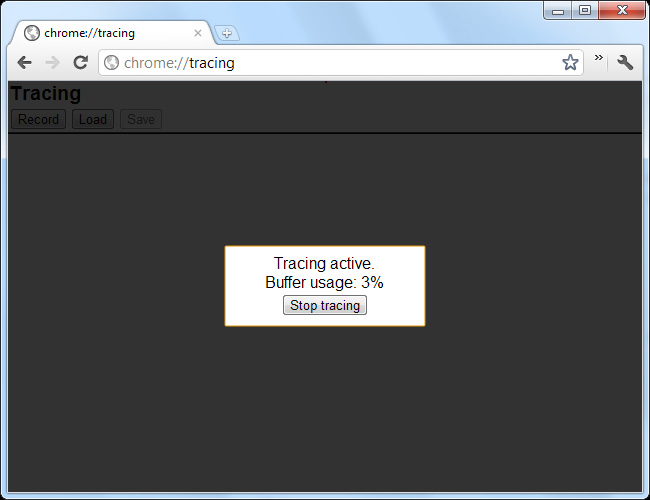
Chrome page : // tracing is actually a tool being developed to allow users to analyze Chrome 's performance. Just press the Record button and Chrome will start working:
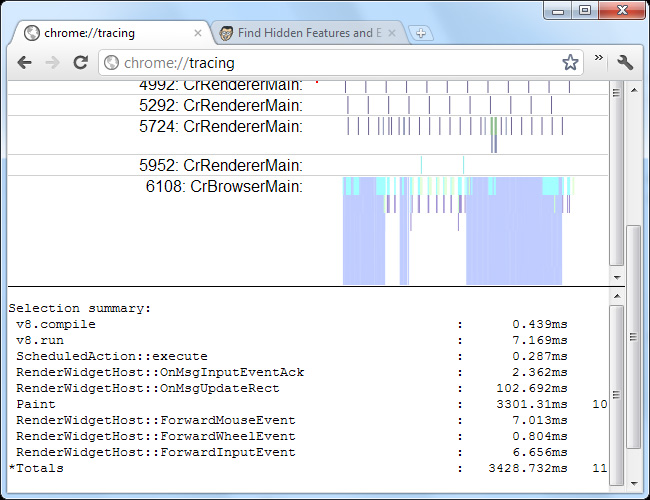
When this process is complete, we can easily know what activities are taking place and take up much of the system's hardware time and resources.
Besides, there are many other sites like, chrome: // flash showing information about flash plug-in, chrome: // sync-internals will show the process of syncing data of Chrome. Good luck!


 How to fix The installer error uncompress archive on Chrome
  How to dual boot Chrome OS and Windows 10
  How to Fix Google Sheets 'Still loading ...' error in Chrome
  How to enable uBlock Origin and Manifest V2 extensions on Chrome
  How to browse multiple websites with the same Chrome tab
  Download ARChon 2.1.0: Android emulator for Windows PC