Instructions on using Desmos to plot mathematical graphs.
We can use Desmos to draw mathematical graphs and interact directly with the interface to adjust the graphs according to the changing functions..
Desmos is a highly effective website for teachers and students in mathematics. We can use Desmos to draw mathematical graphs and interact directly with the interface to adjust the graphs based on changing functions. Below is a guide on how to use Desmos to draw mathematical graphs.
How to use Desmos to plot mathematical graphs.
Step 1:
We can access the link below to register an account and save our graph.
https://www.desmos.com

Step 2:
Next, click on the Graphing tool to begin.

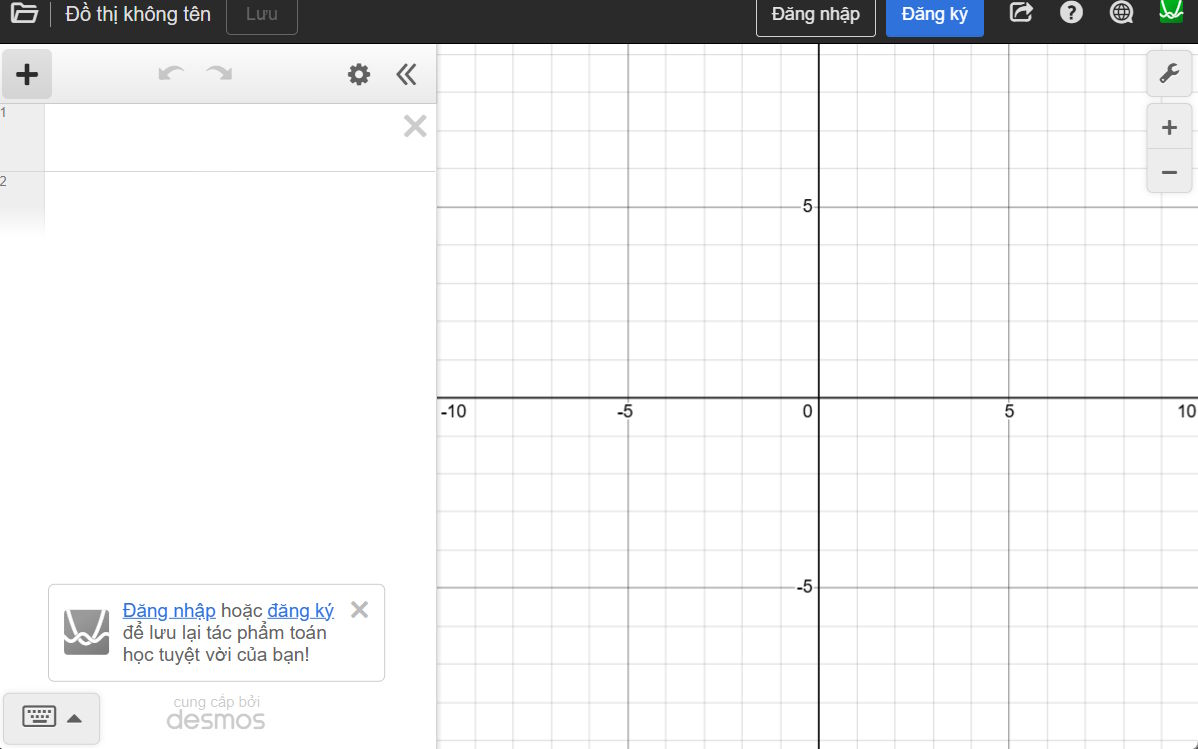
This is the graphing interface in Desmos; on the left is a bar where you can enter mathematical formulas and functions, and next to it is the graph representing that function.
Step 3:
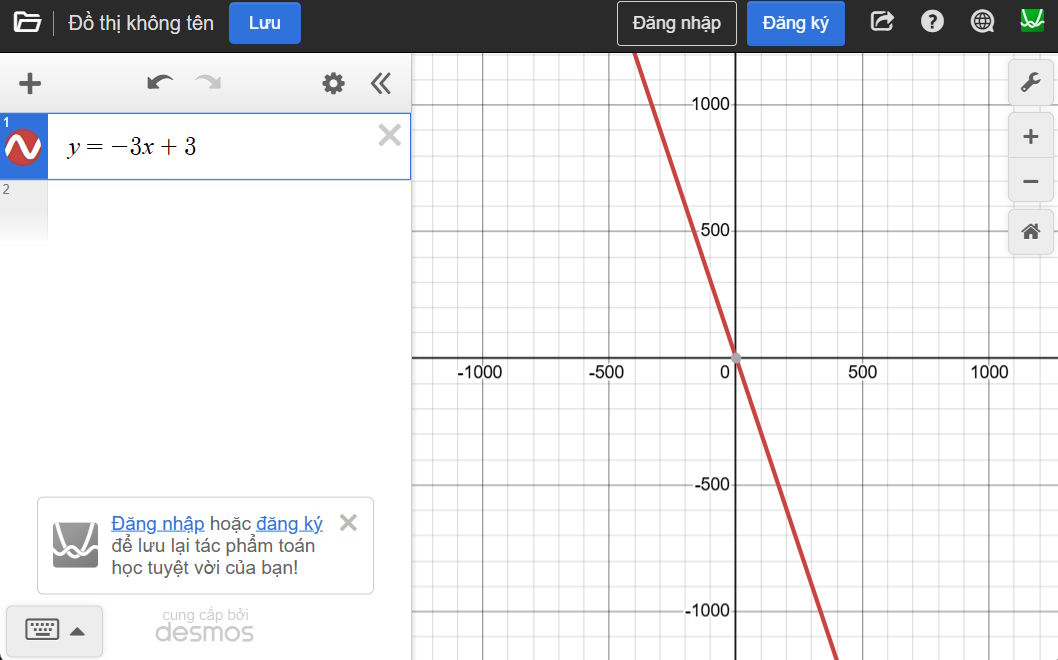
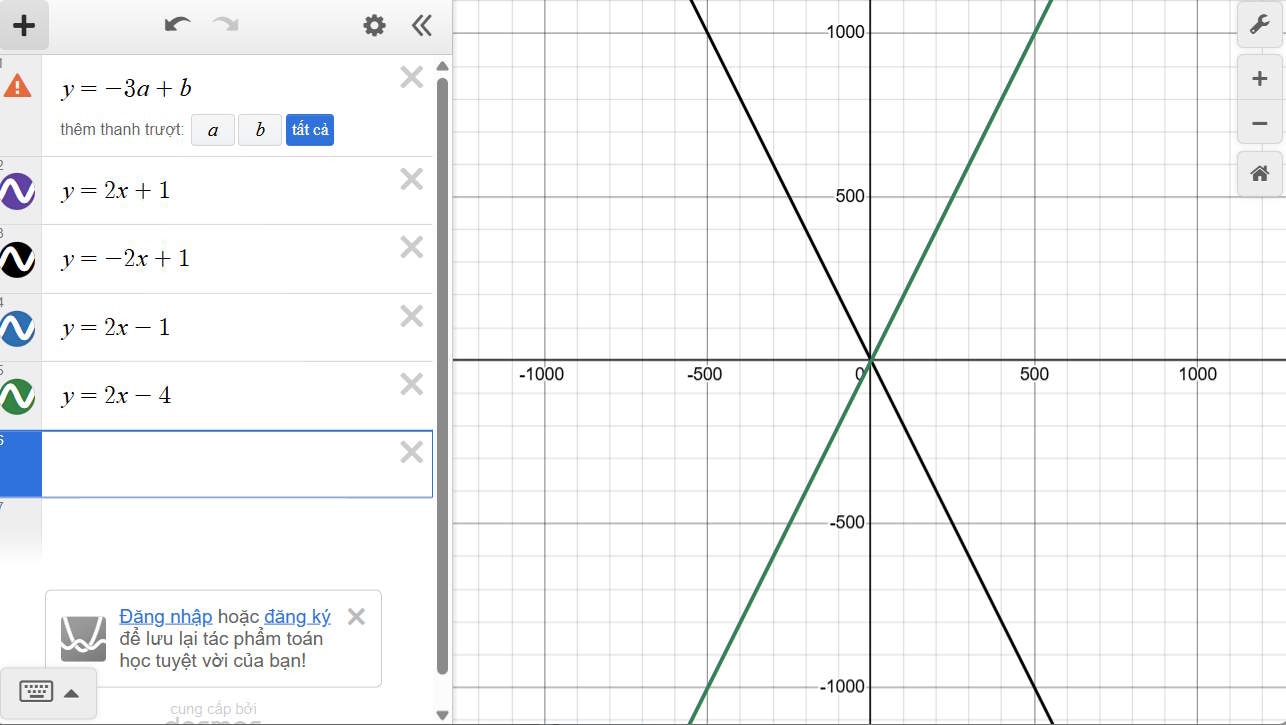
First, we enter the function into the interface on the left , and immediately we will see the graph displayed on the interface next to it .
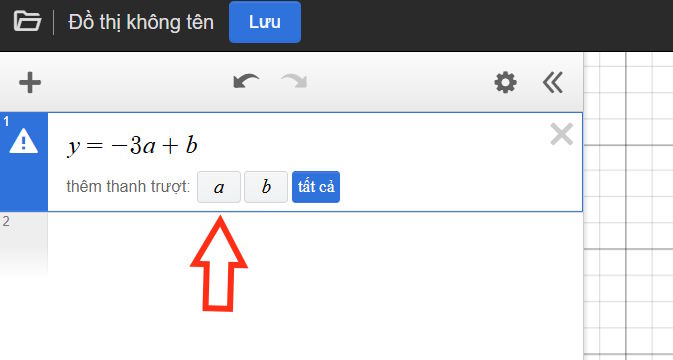
Additionally, you can also change the part of the function containing a and b , at which point you will have the option to add sliders for a and b to change the values directly on the graph.
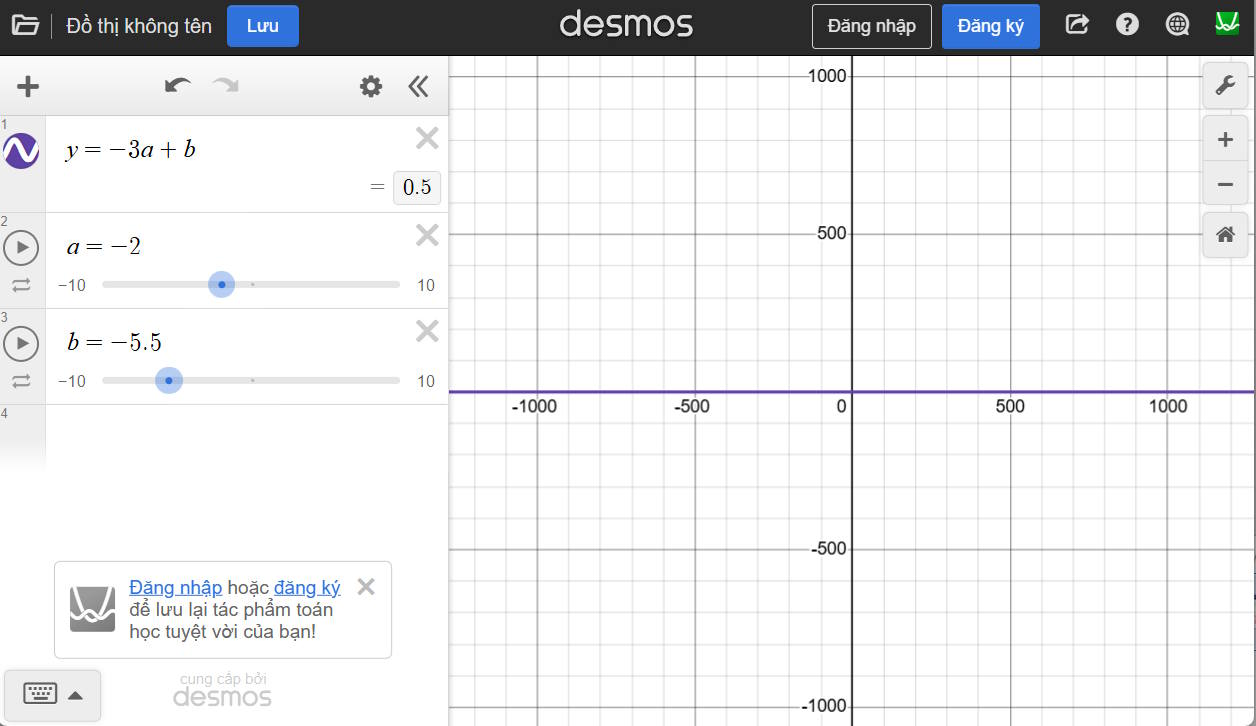
When you change the values of 'a' and 'b' using the sliders, we see that the graph also changes accordingly.
Step 4:
To add a new function , click on the white area below the first function and then enter the new function. Each graph is displayed in a different color.
Step 5:
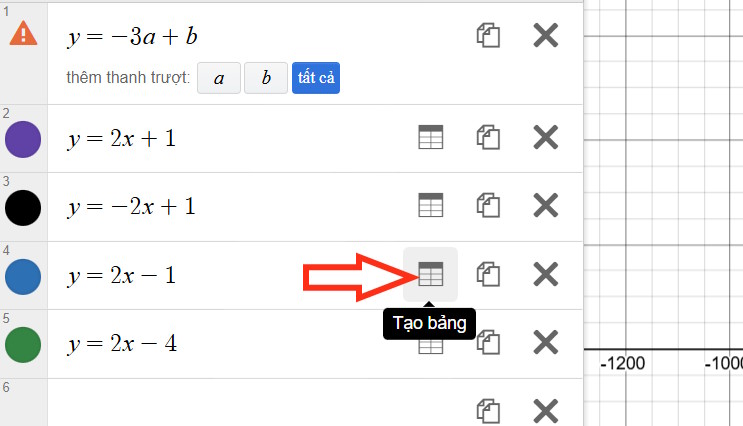
We click on the gear icon and then select the "create table" icon in the function graph.
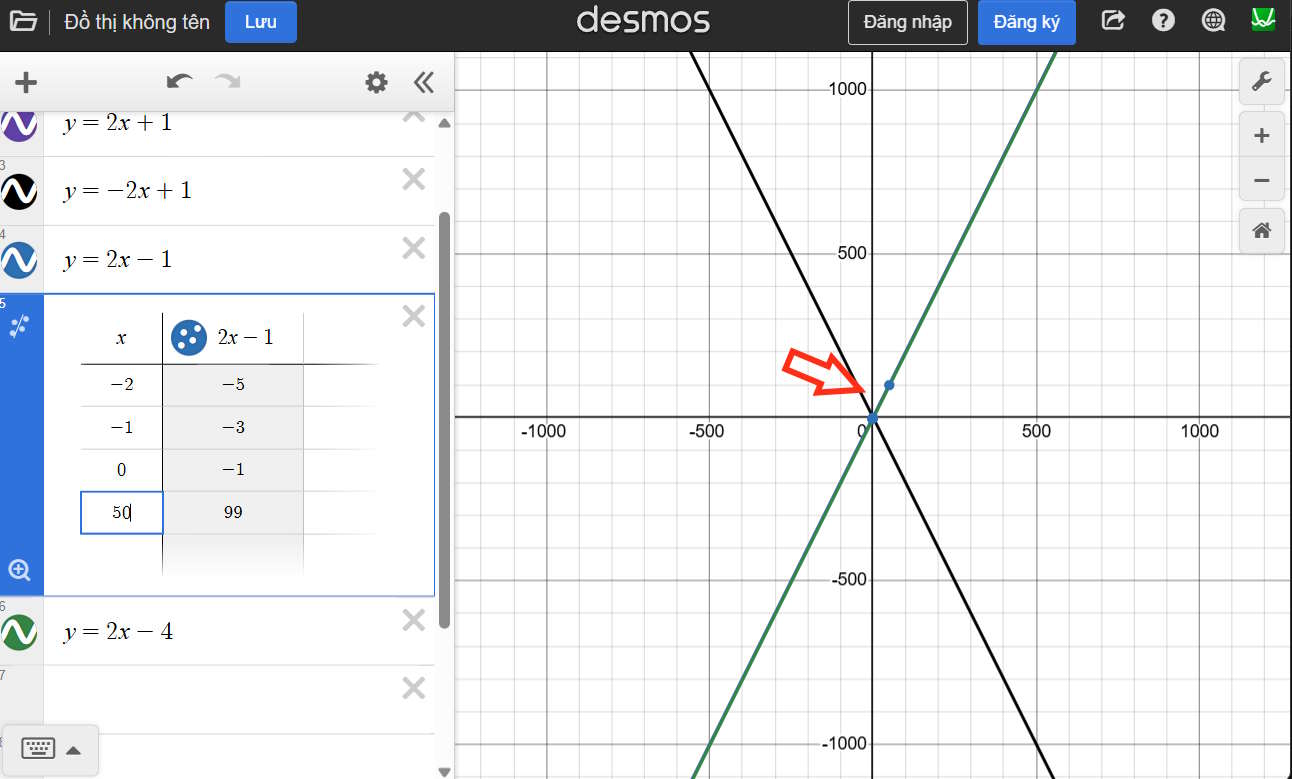
Here, when you enter the value of x , you will see the coordinates displayed in the graph change accordingly.
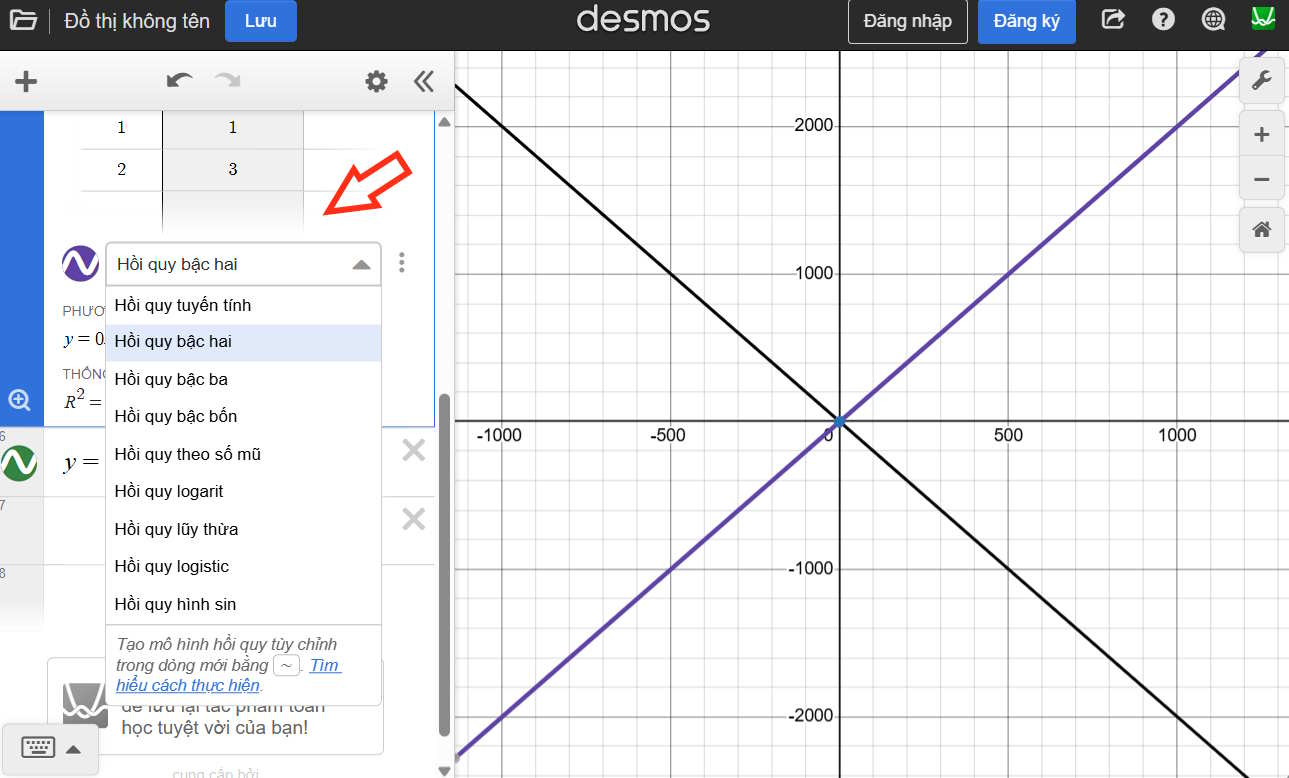
Additionally, clicking on the circle icon in the order column allows you to add linear regression analysis as shown below.
Thus, with Desmos, teachers can directly display function graphs to students and interact with them to change the values.