Table of Contents
No need to waste time manually creating and formatting tables; Google Sheets can now instantly convert various types of content into tables. With Gemini's support, you can convert lists, paragraphs, or JSON data into tables in a flash.
When the content is suitable, Gemini immediately displays the resulting data table for the user to review. You can also edit the data table to make it more complete according to your needs, using descriptive commands. Below is a detailed guide on how to do this.
Convert content to a table in Google Sheets using Gemini.
The process is extremely simple; with the eligible data, you just need to copy and paste it into the Google Sheets interface. Then you will see the "Convert to Text" option to use Gemini.
Step 1:
For example, when pasting JSON data into the Google Sheets interface, you click " Conversion successful" to perform the conversion.
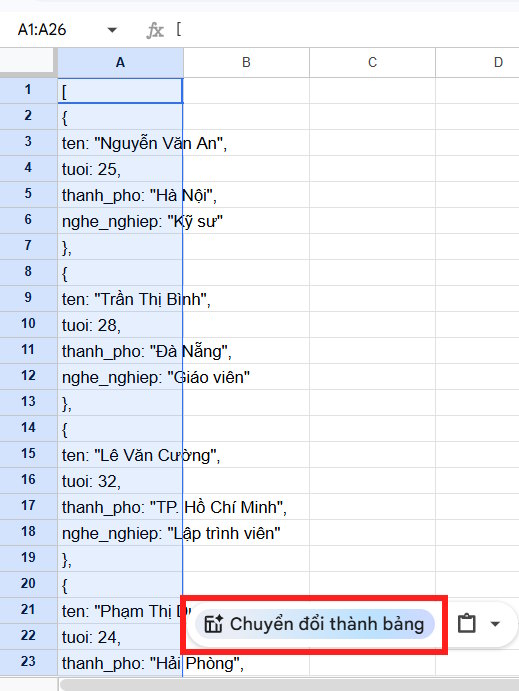
The data is then analyzed and converted into a table. Gemini provides a preview of the generated table.

Then, in the Google Sheets interface, you will see the table displayed as shown in the image. If you are satisfied, click Insert to add the table to Google Sheets.
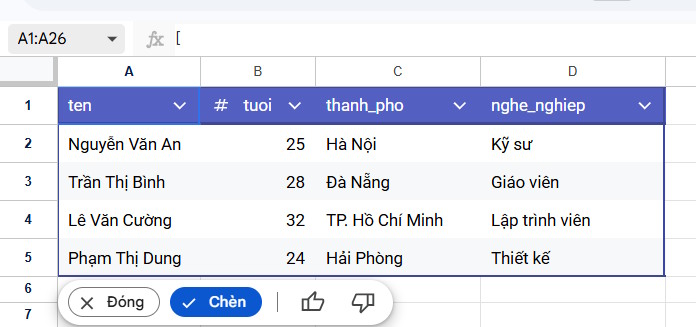
If you're not satisfied with the table, you can enter your edit command in the Gemini chat box on Google Sheets.
Step 2:
You enter your request to change the data table according to the content you need to edit.

The Google Sheets data table has now been modified according to your description. If you want to use it, click Insert.

The finalized table has been inserted into the Google Sheets data table as shown below.
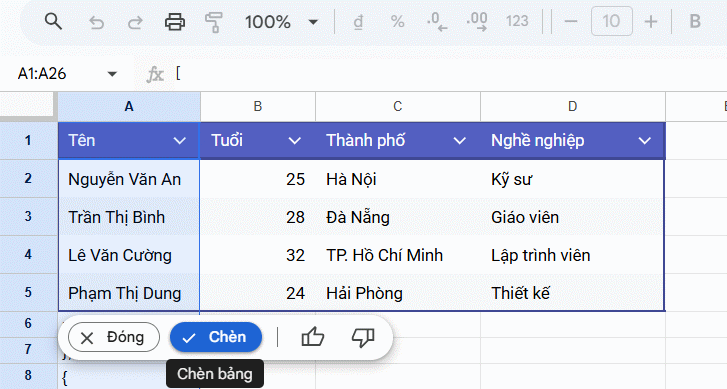
You can choose to insert it into a new worksheet or insert it directly into the current worksheet.

You can try the list format below.
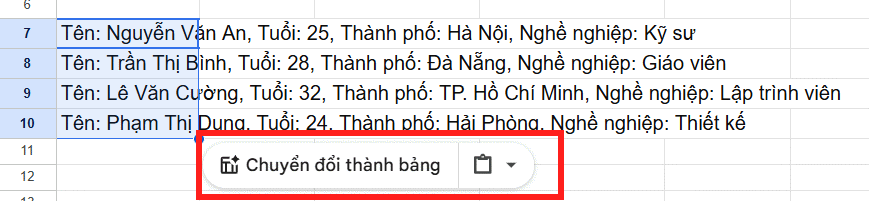
As a result, we also get a Google Sheets data table.
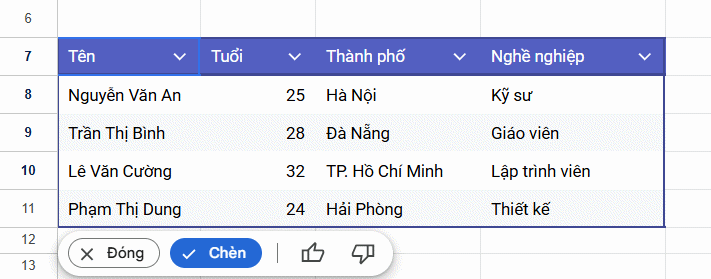
When pasting text into Google Sheets, you can also have Gemini convert it into a table.

The data table is also complete within the Google Sheets interface.
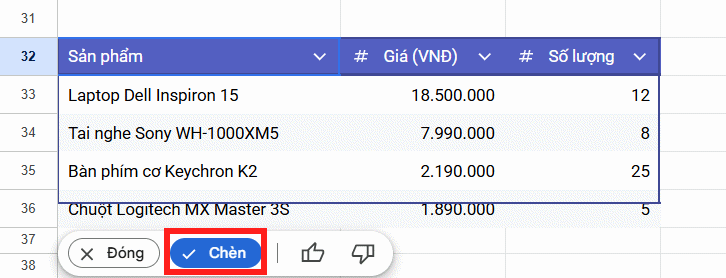
Besides this available option, you can also highlight the content and then type it into the Gemini chat box on the right to request it be converted to a table.
How to create a table in Google Sheets
Step 1:
First, highlight the Google Sheets data range you want to create a table from. Then, right-click and select "Convert to table" to proceed.
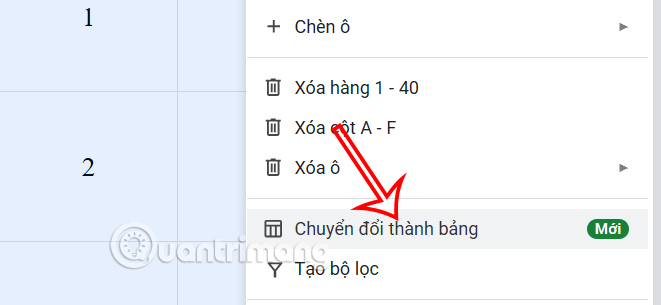
Step 2:
You will immediately see the Google Sheets table created with the table format shown below. The table colors and headers are automatically adjusted, along with filters and adjustments for each data column so that users can use them right away.
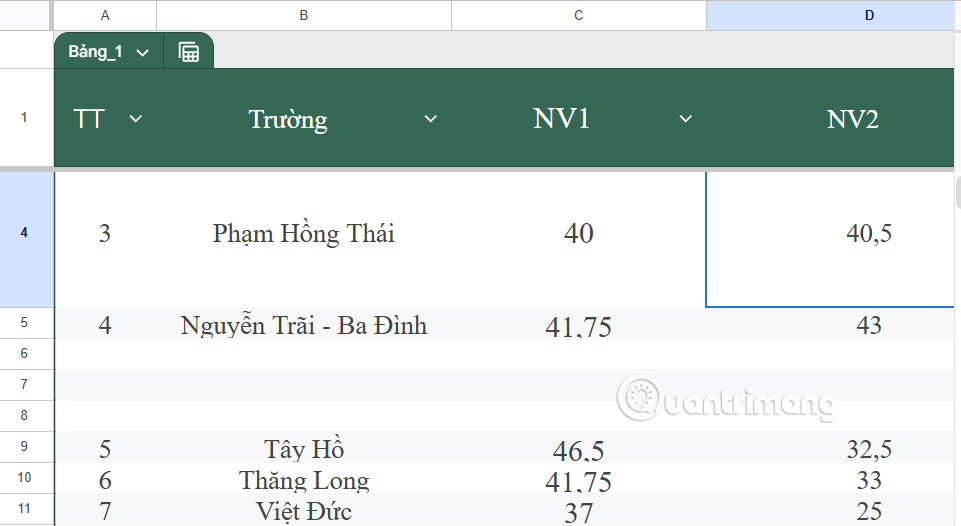
Step 3:
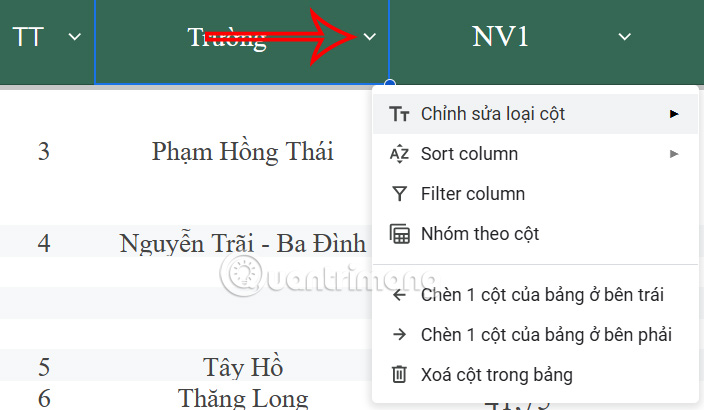
Clicking on the arrow icon in each column will display the column settings as shown below.
Step 4:
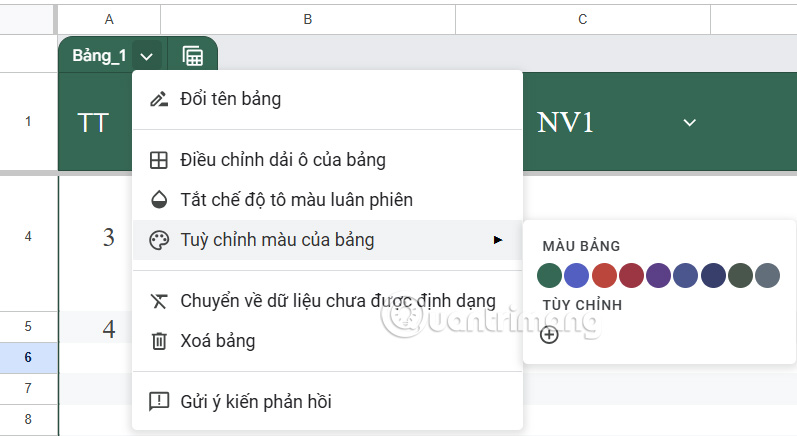
Excel data tables also have customization options. In Table_1, we click the arrow icon to use table customizations, such as naming the data table.
Step 5:
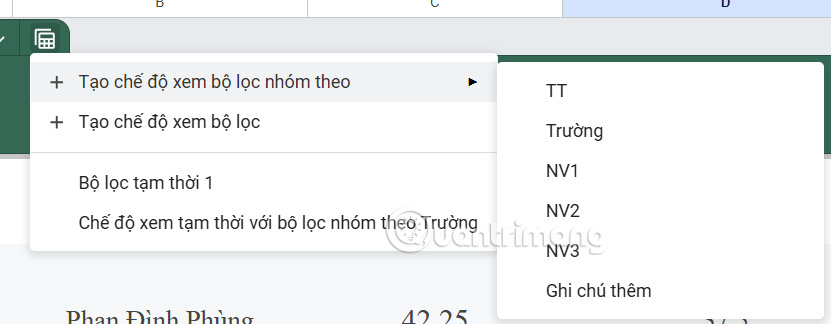
Specifically, you can monitor the data table content by group ; click the view icon and then select the filter view for each data group.
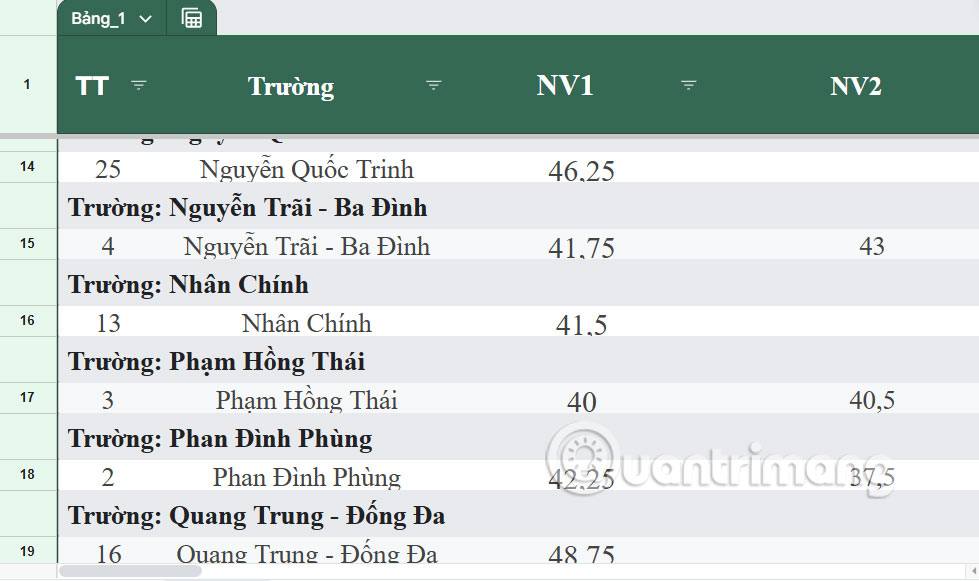
For example, if you select the Field filter, the table will automatically switch to Field view.
Step 6:
Google Sheets has an option to save field-based views so users can reuse them later. You can click Save View in the upper right corner of the interface.
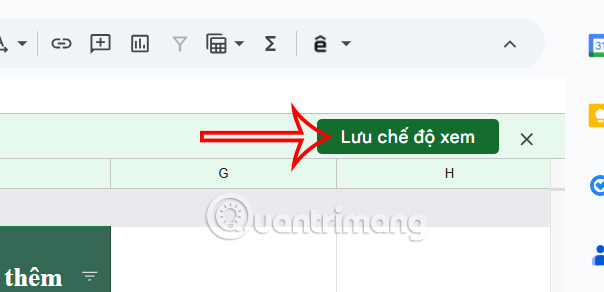
Next, name this view and press Save to save it. If you want to return to the normal view, simply turn off the save function.

Related Articles
 How to Align Spreadsheets Before Printing on Google Sheets3 minutes read
 How to Convert Google Sheets to PDF7 minutes read
 Google Sheets Automatically Creates Tables with Just 13 minutes read
 How to Highlight Duplicate Content on Google Sheets4 minutes read
 How to Convert Images to Text in Google Sheets4 minutes read
 How to Convert Numeric Dates to Text on Google Sheets6 minutes read
Reader Comments 0
Sign in with email or Google to join the discussion.