Data analysis with Network Monitor
For a network administrator, a very important operation is to control the traffic that runs on your network. However, because the number of packets on the network is very large, it is almost impossible to track the contents of each package. Network administrators can only monitor the different types of protocols that are sending and receiving packets on the network. The job
For a network administrator, a very important operation is to control the traffic that runs on your network.However, because the number of packets on the network is very large, it is almost impossible to track the contents of each package.Network administrators can only monitor the different types of protocols that are sending and receiving packets on the network.Network monitoring tells us which applications are used by the bandwidth.
At the same time, we know users on the network who use file-sharing software or some kind of Trojan that secretly sends illegal information on the network.Network monitoring is not as complicated as many people think, Microsoft has provided a tool to enable network monitoring is quite effective on Windows that is Network Monitor software.This article will show you how to use Network monitor as a network bandwidth monitoring tool.
There are two versions of Network Monitor tool that come with Microsoft products. The collapsed version of Microsoft Windows 2003 only allows analysis of incoming and outgoing packets to a server running Windows 2003 server. The full version is included in SMS Server, allowing monitoring traffic from any network device. to know which users are using the most bandwidth. The full version also allows you to determine which users have the most network bandwidth, locate the routers in the network, and resolve the device name to the MAC address.
A function that has been omitted when deploying the Network Monitor toolkit for Windows 2003 server compared to the full version of SMS server is the ability to capture packets, change content, and retransmit packets to the network. The reason is that this function can be used by hackers to perform replay attacks. In this attack technique, hackers seek to capture some important information in the network (eg authentication packets). After that, in order to log in as another user, hackers change internal Use the packet to swap the source and destination addresses and then re-transmit the packet.
Install Network Monitor
Windows Setup program does not install Network Monitor by default. So to install Network Monitor, go to Control Panel and click the Add / Remove Windows Components button to run the Windows Components wizard. Browse the list of components until the selected location for Management and Monitoring Tools, select the Management and Monitoring tool, and click Details. Select Network Monitor Tools, and then click Next. Windows will begin the installation process. , during installation, you may be asked to insert the CD into the device. After installation is complete, click the Finish button.
Start Network Monitor
After installing the Network Monitor tool, you can enable it in Windows' Administrative Tools toolkit. Initially, when Network Monitor is loaded, there will be a dialog box for the user to select the network to capture the data package on. Click OK, the Select a Network dialog box appears. The simplest way is to expand the My Computer folder tree and select the network card to be monitored. Click OK to continue.
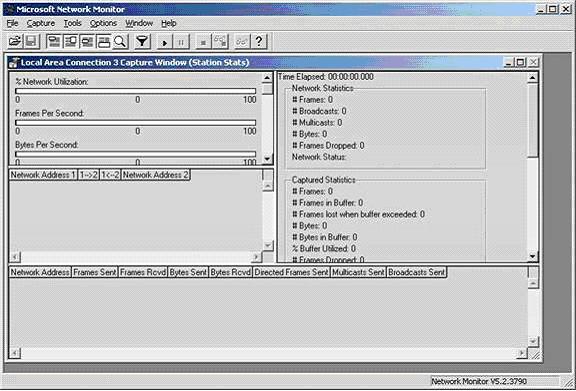
The main interface of Network Monitor software
At the beginning, the interface of the program has nothing because the packet capture process has not started yet. Users are in control of the entire process, but it is best to start a filter before starting the process. This filter defines the specific types of packets captured and displayed on the Network Monitor screen, avoiding the possibility of catching too many packets that prevent users from analyzing. There are two types of filters in the program: capture filters and display filters.
Packet catcher allows you to define packets captured for analysis. For example, you can adjust the program to capture only HTTP packets.
The display filter works similarly except that all packets on the network are captured, it filters the data to be analyzed at the time of analysis, not at the time of packet capture. Display filters use more hard disk space than captured filters, but the information is richer.
Getting package
To configure the filter, select Filter in the Capture menu.If not, start the capture process by clicking the Start command on the Capture menu.The packet capture process will be displayed as shown in the figure. Once the packet is needed to analyze, stop the process with the Stop button.
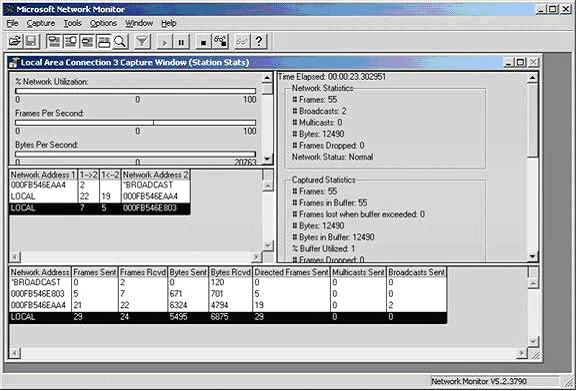
This is Network Monitor's packet capture process
Data analysis
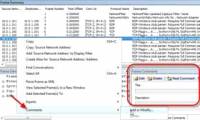
To interpret the data, select Display Captured Data from the Capture menu, the screen will appear as follows:
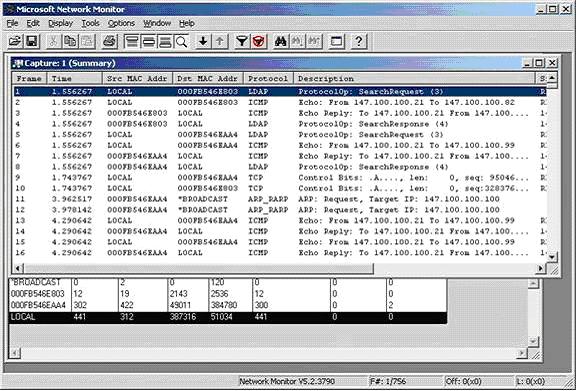
The image above is a list of all packets captured in the correct order. The data in the image above is not filtered, so the information displayed is a lot, you can configure the filter to reduce this amount of information: select the Filter command in the Display menu.
Users browse in the window to view the packets, when finding the required packet, double-click to see the details of the packet, the following figure is an example:
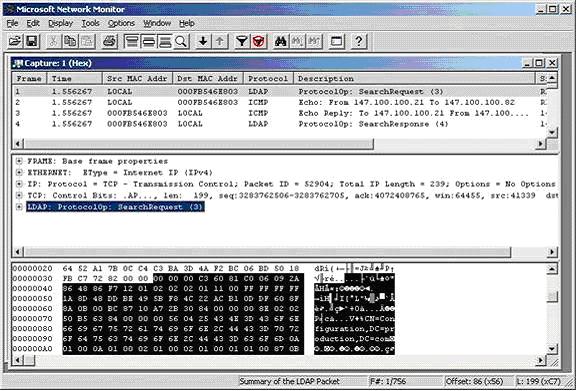
In the display screen, the package content is divided into 3 parts. The top part shows brief content. Users can quickly find and select the packets to be analyzed in this window.
The second part is the content of the packet after it has been decoded and displayed as a hierarchical tree. In the image above, the root section is titled FRAME: Base Frame Properties. If you expand that section, you can see specific information such as the time and date that the frame is stored, frame number, and frame length.
The third part shows the raw data content that makes up the packet. In this section, the leftmost column displays the base address of the bytes on a data stream as hexadecimal numbers. To determine the position of hexadecimal characters, add the base address value to the column position of the hexa character to be positioned. For example: the base address is 00000010 and the character to specify the correct address in the 12th column, the address value will be 0000001B (0000001B = 00000010 + 0000000B).
The rightmost column contains the information that is displayed again in decimal. All information is displayed in the usual, easier-to-read text format. For example, an unencrypted e-mail is captured by Network Monitor, when it is possible to view the full content of the message (of course, the user must correctly locate the message containing the email message in the row. series of packages that Network Monitor caught). In the figure is an LDAP packet that requires the Active Directory service.
By using Network Monitor built into Microsoft Windows, network administrators can easily monitor many other traffic in the direction and direction of a server.
Was this article helpful?
Your feedback helps us improve.
Related Articles
 Network testing with Network Monitor 3.4 - Part 17 minutes read
 What is data analysis?3 minutes read
 Learn about Network Monitor (netmon) 3.37 minutes read
 Use Wireshark to analyze data packets in the network5 minutes read
 Learn about Microsoft Network Monitor tool - part 17 minutes read
 Things to know about a network intelligence analyst6 minutes read
Reader Comments 0
Sign in with email or Google to join the discussion.