Network testing with Network Monitor 3.4 - Part 1
In this article, I will show you the network monitor tool Network Monitor 3.4 and its usefulness in troubleshooting and analyzing network traffic.
In this article, I will show you how to check Network Network 3.4 and its usefulness in troubleshooting and analyzing network traffic.
Analysis of network traffic today becomes an extremely important issue because network protocol stacks have come up with routable and NAT-capable web protocols. Network Monitor is a protocol analyzer and a capture tool for data frames that helps users to detect and test these complex types of protocols, which is really an important tool in administrators' toolboxes. network members and staff.
If you're interested in transferring sensitive data or packaged loads, you'll know more about your network. Tools like IPS, IDS and firewalls are also effective, but they do not describe the details of the packets at the level you need to know. There are many free or paid data discovery tools, but this article will focus on a free tool, Network Monitor 3.4.
What is protocol analyzer? (Protocol Analyzer)
This is an application or piece of hardware capable of capturing network traffic and analyzing data passing through it, giving the output an easy-to-read format for people.
About this tool
Hardware specifications: Network Monitor 3.4 requires a minimum of 1GHz processor, 1GB of RAM, 60MB of hard drive for capture.
The program can be installed on x86 and 64bit platforms, including Itainum chipsets running Windows XP and higher.
Once you have downloaded and installed the application from the Microsoft website, it is possible to perform the capture.
You can choose which interfaces you want to listen to traffic on. Experience has shown that we should start at a minimum to ensure that we will not be overwhelmed by too much traffic. You can then change this setting and add other interfaces if needed.
One of the most interesting features of the product is the ability to check traffic and combine it with the running process, from which administrators can quickly distinguish which applications are exchanging with machines and models. Traffic is sent without having to crawl through tons of confusing traffic.

Figure 1: The picture above shows a skype chat
You can filter the traffic of a certain conversation at a time. This can be seen in the image above via the Conversation ID (ConvID) 468. When you expand the frames in the conversation, you can test it again.
Users can also color-code traffic for filters, set one-color source traffic, and respond to traffic in another color to distinguish who said what.
In addition, users have the ability to set NM3.4 to capture traffic in a VPN tunnel. This is very useful when troubleshooting VPNs.
Another interesting thing about this tool is that the data is completely live, like what you see in the interface. This data can be saved in a file and can be sent to someone if you need to share the output of the analysis process. You can also select a range of frames. The range of selected frames can be saved and sent to another third party by analysis instead of sending all captured data.
Data can also be copied directly into Excel for analysis and charting purposes, and can be applied similarly to words and tables can be quickly created for detailed cases. This allows easy data management and easy presentation.
Create a color filter
Creating filters completely simple. A color filter is a combination of a certain process and a color. For example, you want to see all IE traffic in the real-time view is green and Firefox traffic is red. All you need here is to expand the process in the conversation window on the left and select the traffic in the right summary pane, right-click the frame (on the process column), click Add 'process name 'as color rule , set color and all traffic will appear green for IE process.
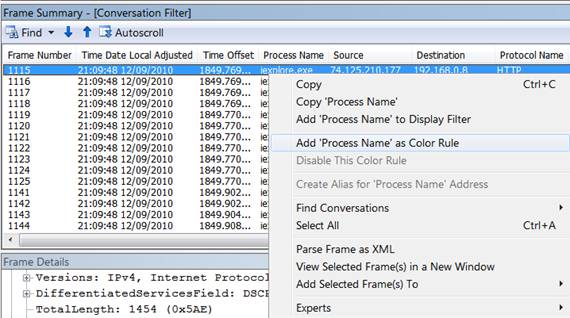
Figure 2: Remember to click the process name column (Process Name)
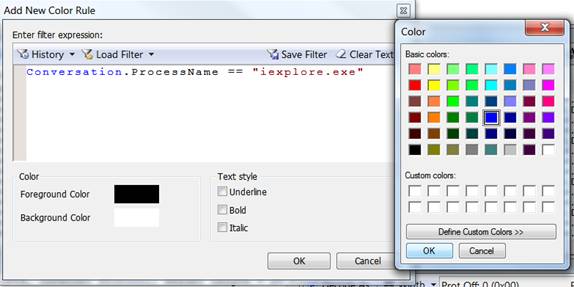
Figure 3: Choose color to combine with IE process, then click OK and OK

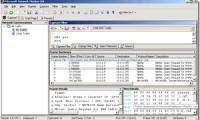
Figure 4: In the real-time traffic view, you will see the traffic flow is green
This allows users to easily distinguish traffic when data packets come in and out at high speed.
Command line utility
Path C: Program FilesMicrosoft Network Monitor 3>
This tool can be used in the command line utility and called NMcap.exe, it is installed in the operating system path. This mode can capture with high performance and is very useful when scripting tools and commands.
Simple commands like nmcap * / capture / file test_capture.cap can capture all traffic from all interfaces and save captured data to a file named test_capture.cap. Filters can also be applied to this command so that only we capture the relevant traffic.
The command line utility is used in many cases, for example, you can apply this at a customer site and get output for remote analysis purposes. Any filter used in the user interface can be used with the command line utility, you just need to remember to add quotation marks.
When using this tool, it is best to set the capture size, first keep it manageable to ensure the capture data does not fill the hard drive.
One of the most useful parameters is terminationwhencommand, which allows the administrator to script to interrupt the capture process after a certain time or when a keystroke event occurs.
To enter a list of parameters, simply type Nmcap.exe / help
Parsing
Parsing is provided for all Windows protocols and for the most common protocols. There are many syntaxes available and you can quickly create your own syntax. These files have the .npl extension and can be compiled with the original tool.
Was this article helpful?
Your feedback helps us improve.
Related Articles
 Working with Network Monitor (Part 2)8 minutes read
 Working with Network Monitor (Part 1)8 minutes read
 Working with Network Monitor (Part 4)8 minutes read
 Interesting quizzes about computer networks - Part 45 minutes read
 Data analysis with Network Monitor8 minutes read
 Learn about Microsoft Network Monitor tool - part 17 minutes read
Reader Comments 0
Sign in with email or Google to join the discussion.