Table of Contents
ChatGPT can present interactive visual explanations for selected math and science topics. Instead of showing only a formula and a paragraph, a response may include controls that let you change variables and see a graph, diagram, or result update in real time.
OpenAI introduced the feature with more than 70 core concepts relevant mainly to high-school and college learners. It announced availability for logged-in users across ChatGPT plans. The supported set and interface can expand over time, so a requested topic may still return a normal text explanation.
How to request an interactive explanation
Start a new ChatGPT conversation and ask directly for a supported concept. You do not need a special command. These prompt patterns are useful:
Help me understand [concept].
Explain how [formula or law] works.
Show me how changing [variable] affects [result].
How can I find [quantity]?
Give me an interactive visual explanation of [concept].
If the response is text-only, ask explicitly for an interactive visual and name the variables you want to manipulate. The feature is intended to appear automatically for supported concepts, but phrasing and availability can affect the response.
Example: slope between two points
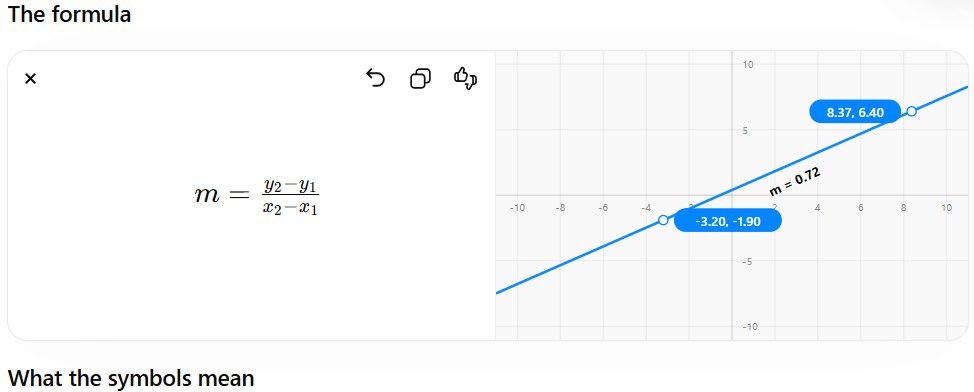
Ask: “Explain the slope formula and show how moving either point changes the slope.” Change the coordinates, predict whether the line will become steeper or flatter, and then compare your prediction with the displayed value.
The slope between two points is:
m = (y₂ − y₁) / (x₂ − x₁)
The denominator cannot be zero; a vertical line has an undefined slope rather than a numeric one.
Example: Pythagorean theorem
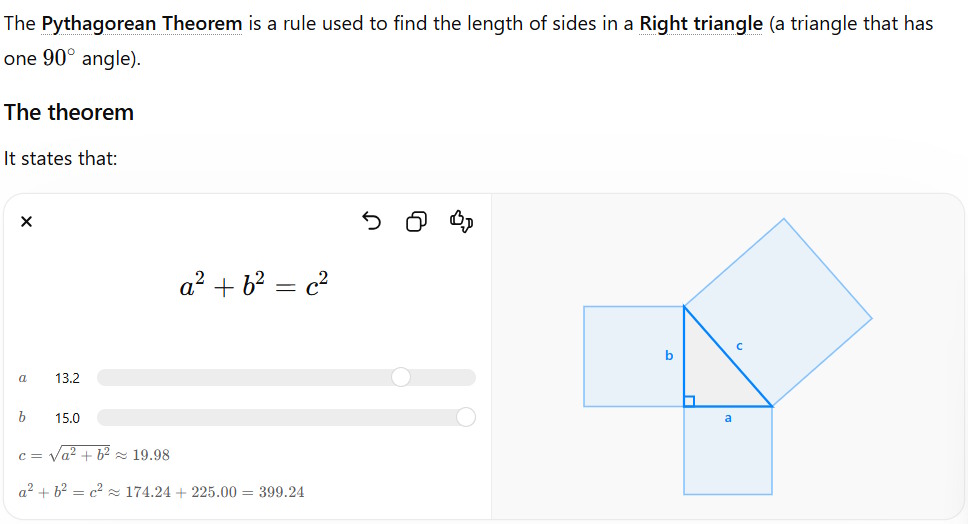
Ask: “Help me understand the Pythagorean theorem with an interactive right triangle.” Adjust the two legs and observe how the hypotenuse changes according to a² + b² = c².
Use the module to test a claim rather than only reading the answer. For example, double both legs and see whether the hypotenuse also doubles. Remember that the theorem applies to right triangles; it is not a general rule for every triangle.
Example: Charles's law
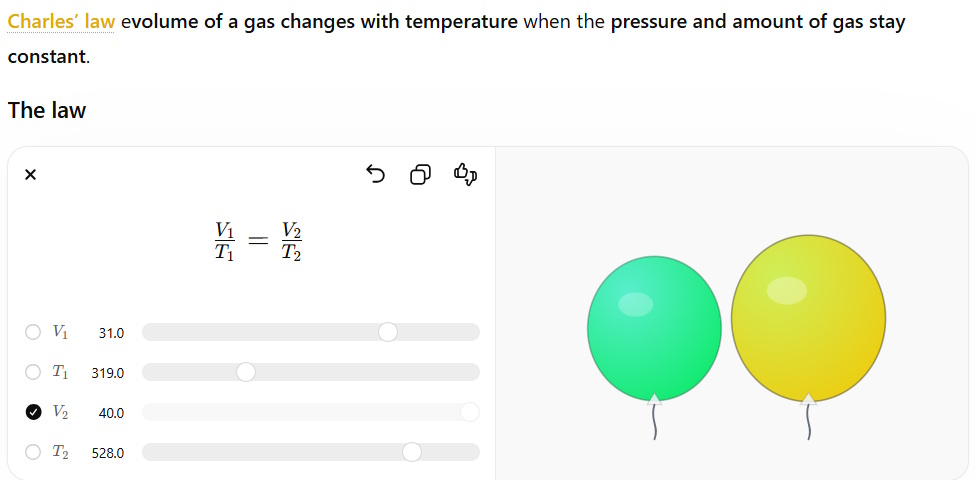
Ask: “Explain how Charles's law works and let me change the temperature.” For a fixed amount of gas at constant pressure, the idealized relationship is V ∝ T, with temperature measured on an absolute scale such as kelvin.
A good visual should make the assumptions visible. If the module uses degrees Celsius directly in a proportional calculation, ask it to explain the conversion and verify the model.
Example: area of a circle
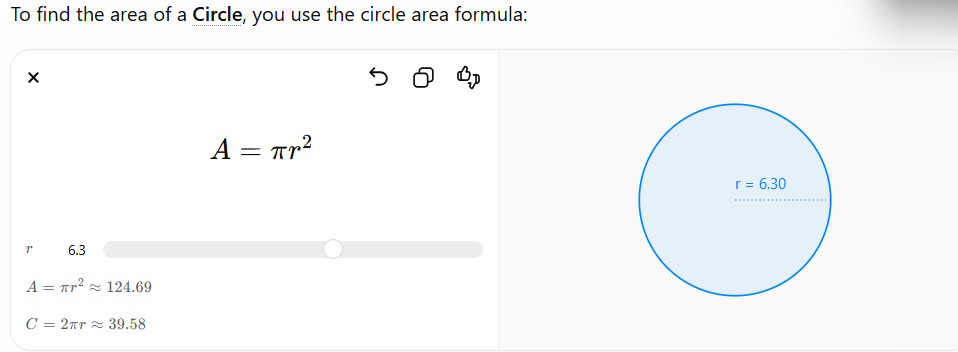
Ask: “How can I find the area of a circle? Show an interactive radius control.” As the radius changes, the area follows A = πr². Doubling the radius makes the area four times as large, which is easier to see when the diagram and value change together.
Concepts to try
OpenAI's launch examples included the Pythagorean theorem, ideal gas law, and area of a circle. Other announced topics included:
- linear equations, slope-intercept form, distance formula, and discriminants;
- circle equations, circumference, triangle area, cone volume, and sphere surface area;
- integrals, integration by parts, exponential decay, and first-order differential equations;
- kinematics, kinetic and potential energy, Hooke's law, and angular frequency;
- Ohm's law, Coulomb's law, lens equations, and period-frequency relationships;
- Charles's law, the combined gas law, Gibbs free energy, and
PV = nRT; - compound interest and selected identities used in economics and trigonometry.
See OpenAI's official announcement about interactive math and science learning for the launch description and examples.
Use the visual as a learning tool, not an answer key
- Predict first. State what you think will happen before moving a slider.
- Change one variable. Keep other values fixed so the relationship is easier to interpret.
- Test boundary cases. Try zero, negative values, or large values only when they are valid for the concept.
- Ask about assumptions. Identify idealizations, units, domains, and constants.
- Verify independently. Calculate one example by hand or compare it with a trusted textbook or instructor.
- Explain it back. Summarize why the result changed instead of copying the displayed formula.
Interactive visuals are especially useful for building intuition, but they can still contain mistakes or omit conditions. Teachers should test a module before using it in class, and students should show their own reasoning when the work is assessed.
Related Articles
 How to Create Visual Vector Simulations3 minutes read
 Transform Experiment Images into Visual Experiments in Canva3 minutes read
 ChatGPT Dynamic Visual Explanations5 minutes read
 How to Implement Chatgpt in Django4 minutes read
 How to Create an Interactive Game Website on Replit3 minutes read
 Top ChatGPT Prompts for Engineers: Practical Guide9 minutes read
Reader Comments 0
Sign in with email or Google to join the discussion.