Table of Contents
ChatGPT can provide interactive visual explanations for supported math and science concepts. Instead of showing only a formula and paragraph, it may add controls that let you change variables and immediately see how a graph, diagram, or result responds.
The feature is useful for building intuition: you can test what changes, what stays constant, and whether the result matches the relationship described by the formula. It does not replace a textbook, teacher, calculator, or experimental measurement, and important answers should still be checked.
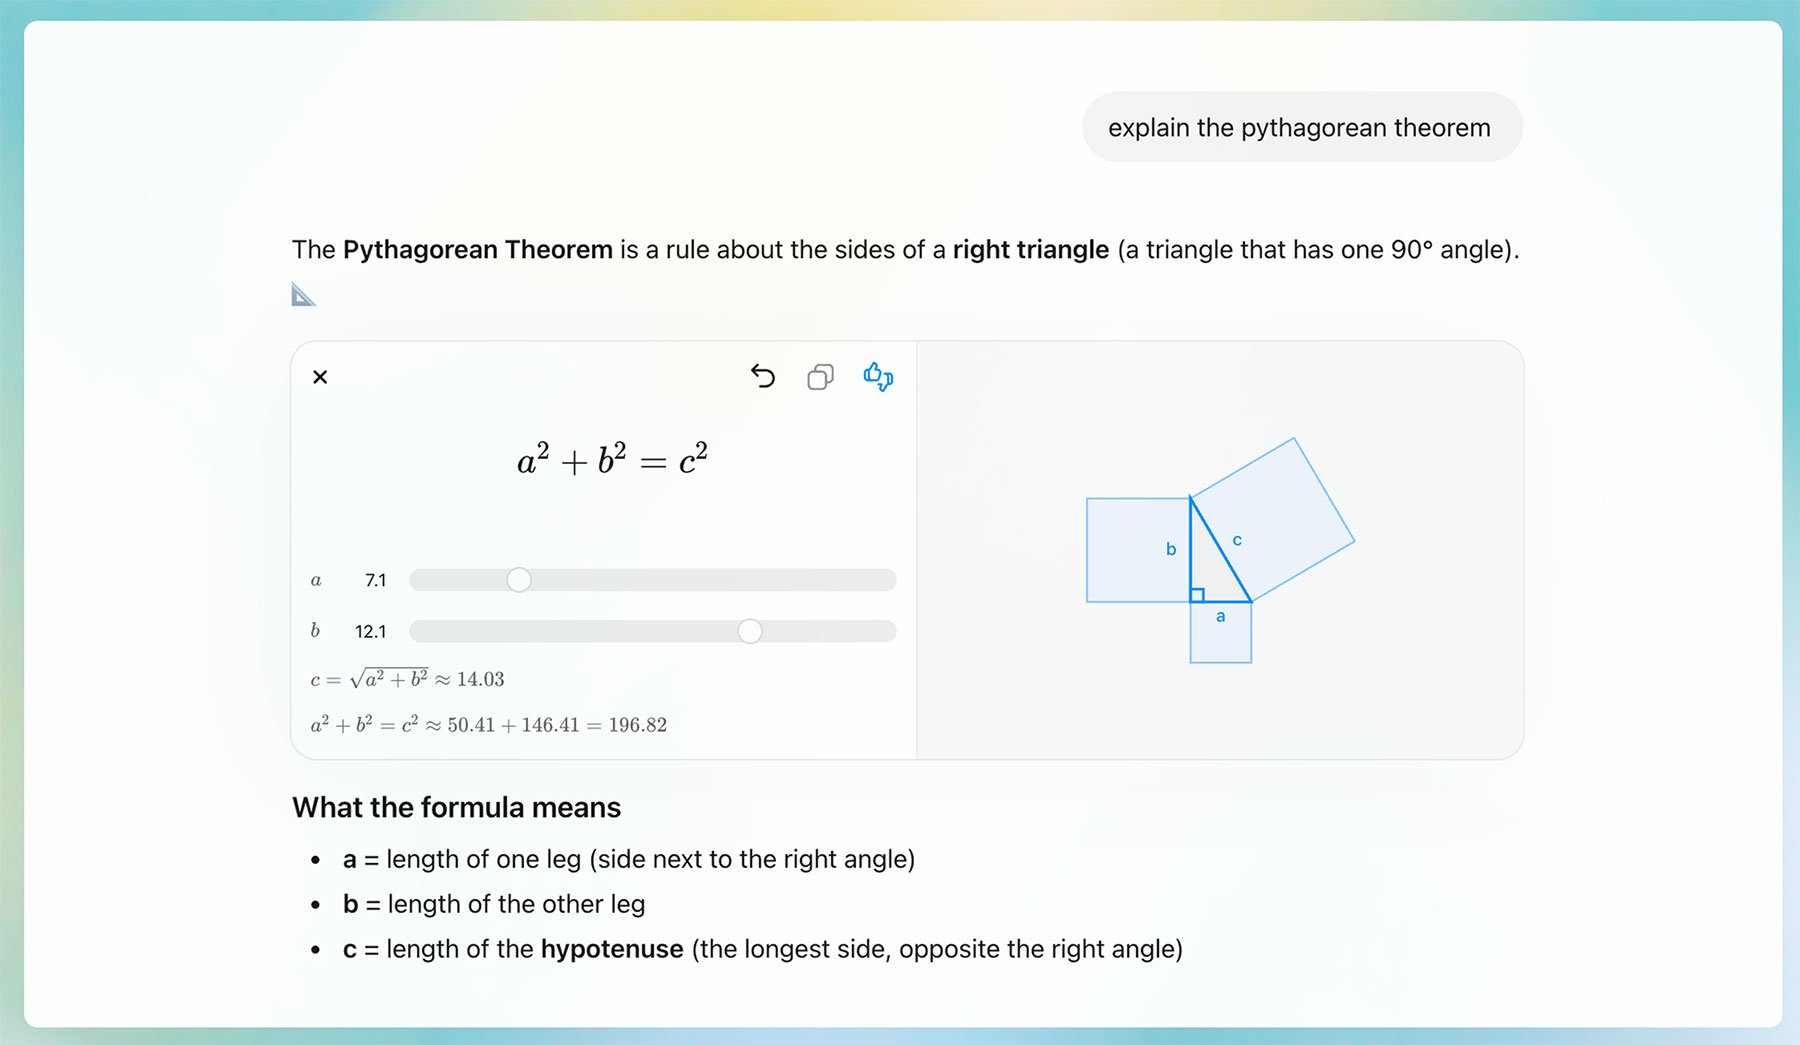
What dynamic visual explanations do
OpenAI introduced the feature with more than 70 core concepts, mainly aimed at high-school and college-level math and science. According to the official announcement, the experience is available globally to logged-in users across plans.
A supported response can combine:
- a plain-language explanation of the concept;
- the relevant formula and definitions of its variables;
- sliders, draggable points, or editable values;
- a graph or diagram that updates as values change;
- follow-up prompts that encourage comparison and prediction.
Examples in OpenAI's announcement include the Pythagorean theorem, lens equation, ideal gas law, circle area, compound interest, Coulomb's law, Hooke's law, kinetic energy, linear equations, Ohm's law, potential energy, and relationships between period and frequency.
How to request an interactive explanation
Ask for the concept, the level of explanation you need, and the variables you want to manipulate. For example:
- “Explain the Pythagorean theorem with an interactive triangle. Let me change both legs and predict the hypotenuse before showing the result.”
- “Show Ohm's law interactively. Keep resistance fixed first, then let me compare what happens when voltage changes.”
- “Visualize compound interest and let me adjust the principal, rate, compounding frequency, and time.”
- “Explain the thin-lens equation with a diagram and label the sign convention you are using.”
If ChatGPT returns only text, ask directly for an interactive visual. The topic may not yet be supported, or the experience may differ by account, interface, and rollout.
A better way to learn with the controls
Moving sliders without a question can become passive exploration. Use a predict-test-explain loop:
- Predict: state what you expect to happen before changing a value.
- Test: adjust one variable while holding the others constant.
- Observe: note the direction and size of the change.
- Explain: connect the visual result back to the formula.
- Check: calculate one example independently or compare it with a trusted source.
For inverse-square relationships such as Coulomb's law, for example, double the distance and predict the effect before moving the control. The learning value comes from explaining why the display changes, not merely seeing that it does.
What to verify
Interactive presentation can make an answer feel authoritative even when an assumption or label is wrong. Check these details:
- Units: confirm that all values use compatible units.
- Domain: note where a formula is valid and where the simplified model breaks down.
- Sign conventions: optics, vectors, and coordinate geometry may use different conventions.
- Constants and rounding: ask which constant value and precision the module uses.
- Axes and scale: a truncated or logarithmic axis can change how a relationship appears.
- Assumptions: ideal gases, frictionless systems, point charges, and perfect conductors are models, not complete descriptions of reality.
If a result matters for graded work, engineering, finance, or safety, verify it with an approved calculator, primary reference, instructor, or domain professional.
Useful follow-up prompts
- “List every assumption in this visual model.”
- “Give me one boundary case and explain whether the formula still applies.”
- “Hide the result until I make a prediction.”
- “Create three practice questions using the same relationship, then check my steps rather than giving the answer immediately.”
- “Compare the graph with the algebraic form and explain what the slope or curvature means.”
- “Show an example where students commonly confuse correlation with causation or proportional with inversely proportional.”
Where the feature helps—and where it does not
Dynamic visuals are especially helpful for relationships that change continuously, geometric constructions, graphs, and systems with several adjustable variables. They can also help learners who struggle to connect symbolic notation with a physical or spatial model.
They are less useful when the main difficulty is proving a statement, choosing the correct model, interpreting an ambiguous word problem, or understanding a concept's historical and experimental basis. In those cases, ask ChatGPT to show the reasoning structure, identify missing information, or compare multiple solution methods.
Use it as a learning aid, not an answer generator
The strongest workflow is interactive: ask a focused question, make a prediction, change one variable, explain the result in your own words, and solve a fresh example without the visual. If you can transfer the idea to a new problem, the tool has helped you learn; if you can only repeat what the module displayed, more practice is needed.
Related Articles
 If You Haven't Used ChatGPT's Special Tools, You're Definitely11 minutes read
 Create Interactive Simulations of Mathematical Concepts on ChatGPT5 minutes read
 5 Reasons to Enable Enhanced Protection in Chrome6 minutes read
 Transform Experiment Images into Visual Experiments in Canva3 minutes read
 Basic Knowledge of Dynamic DNS Service System10 minutes read
 How to Enable Enhanced Anti-spoofing Windows 10?5 minutes read
Reader Comments 0
Sign in with email or Google to join the discussion.