Guide to creating visual vector simulations
With the help of AI-powered web applications, visual vector simulations help transform abstract concepts into clear, accessible concepts for students.
Table of Contents
With the help of AI-powered web applications, vector visualization helps transform abstract concepts into clear, accessible learning materials for students. Using only simple shapes, harmonious colors, and fluid motion, teachers can illustrate complex content visually and logically. Below is a guide to creating vector visualizations.
How to create visual vector simulations for Math
Step 1:
First, you need to click on the link below to access the website; no account registration is required to use it.
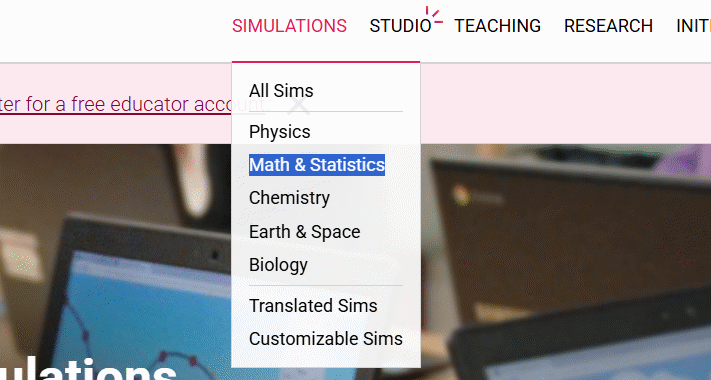
https://phet.colorado.edu/On the website interface, click on Simulations and then select Math & Statistics from the displayed list.
Step 2:
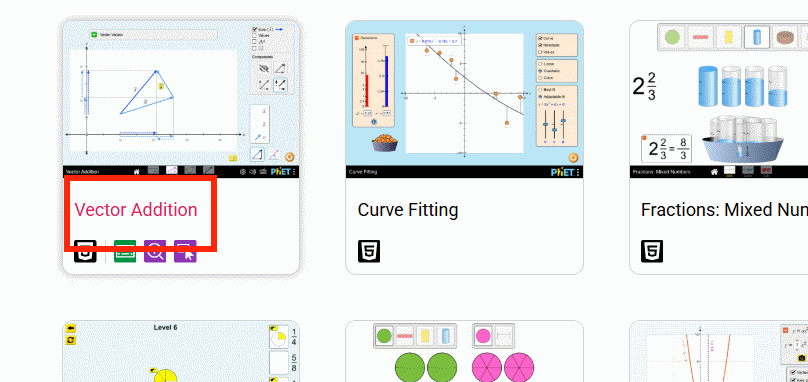
A new interface will appear, and teachers will see many simulations for mathematics. Scroll down and click on Vector Addition .
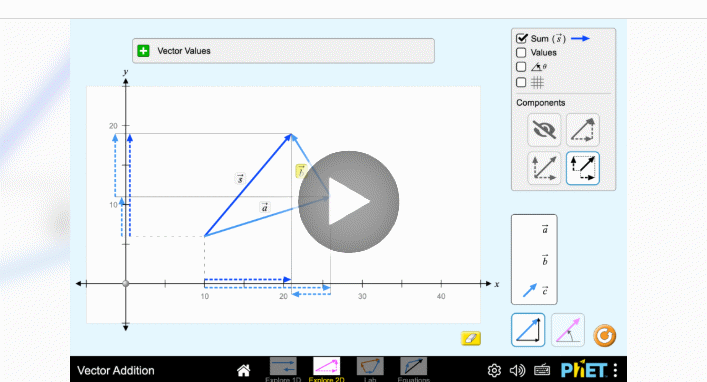
In the vector simulation interface, you need to press the play button in the center of the webpage as shown below.
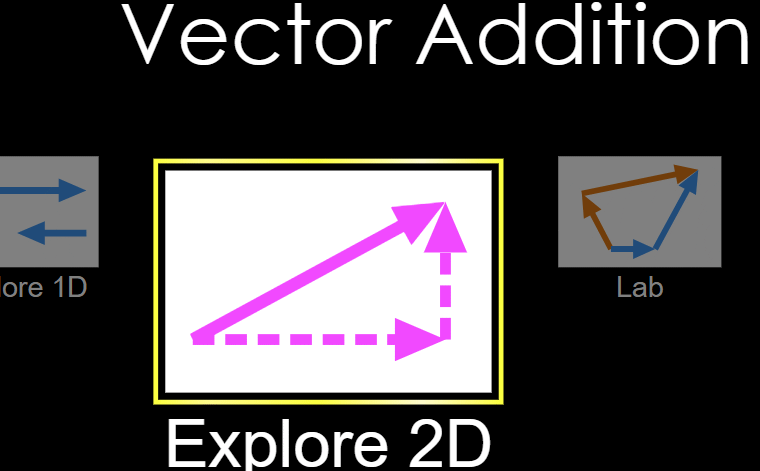
Then the teacher will see the option to create a vector; you can select the 2D vector template to display the vector on the 0xy coordinate plane as in the lesson.
Step 3:
In the new interface, on the right we will see the vector drawing tool, and in the center is the vector display interface.
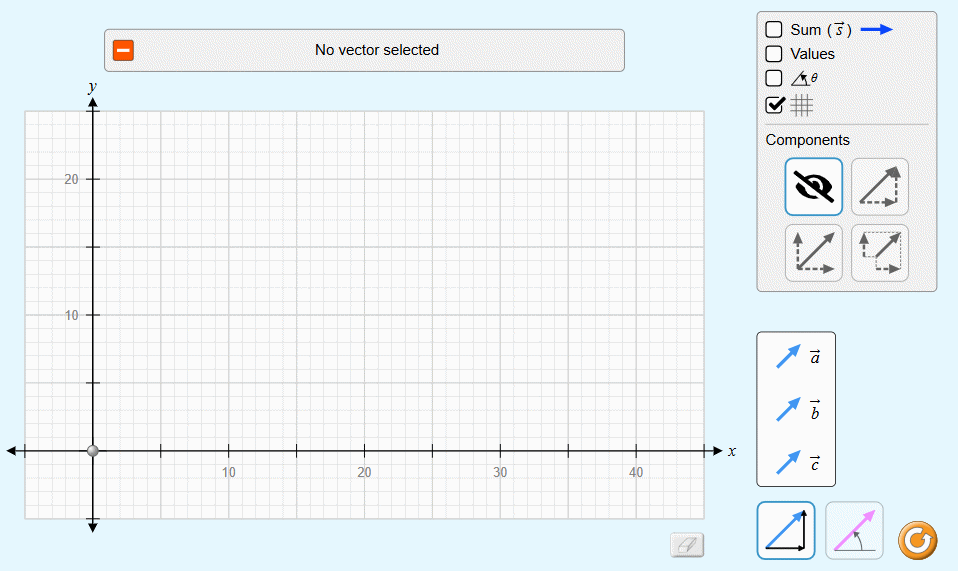
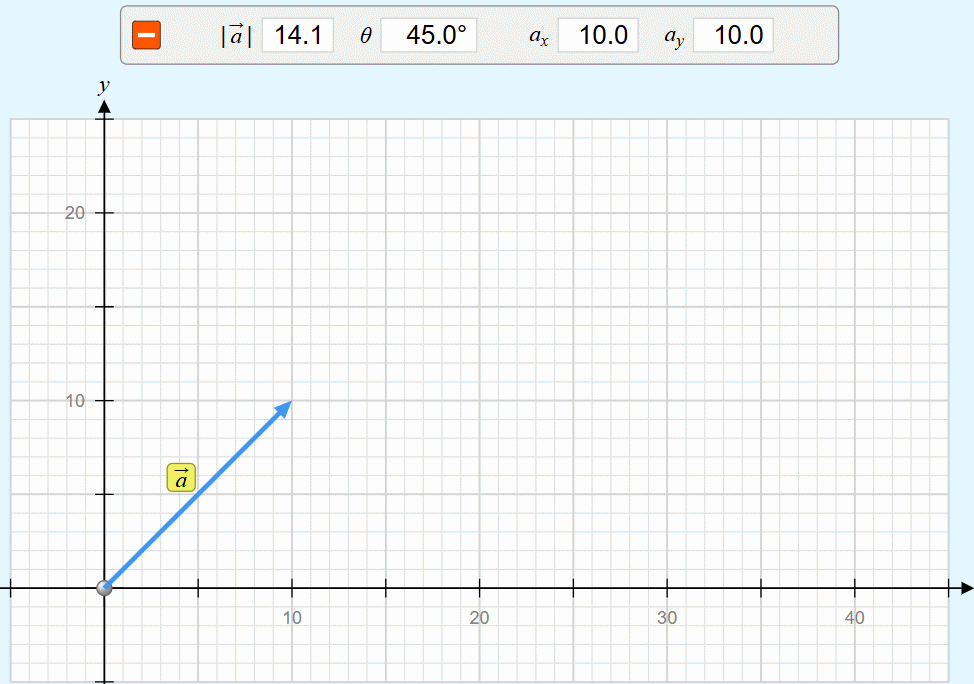
You will click on the vector on the right side and then drag and drop it into the graph interface in the center . Teachers set the vector parameters to match the coordinates in the lesson or the coordinates they want to represent to the students.
Step 4:
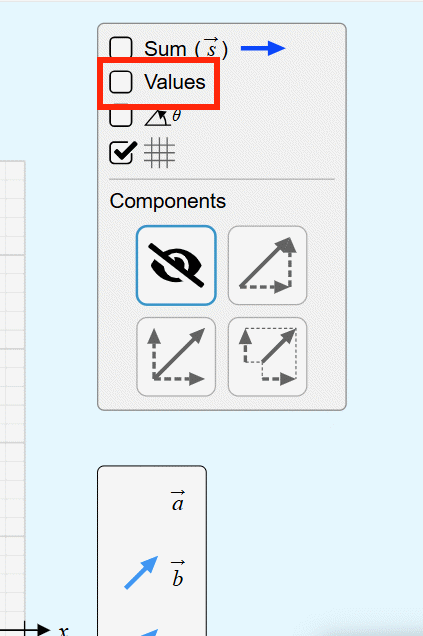
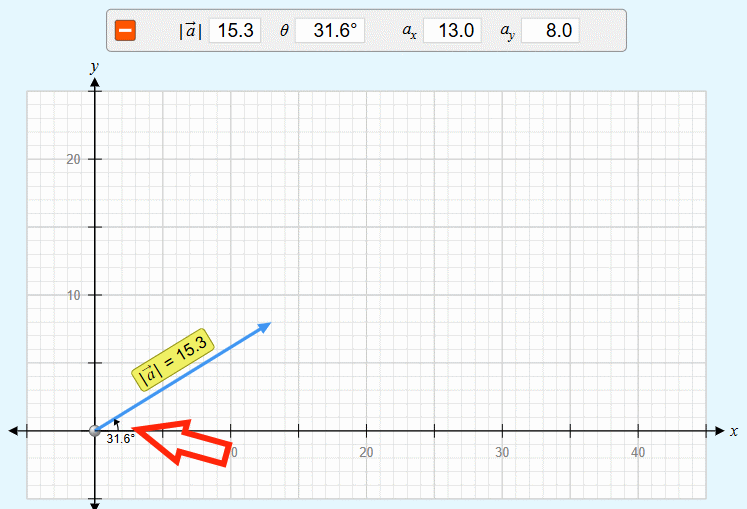
The teacher waits for the students to finish the calculations, then proceeds to check the results. The teacher looks at the right side of the interface and clicks on the "Values" box to display the values.
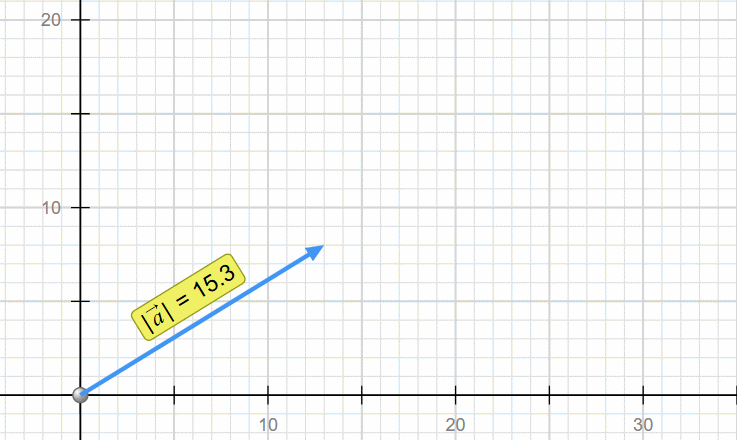
Immediately afterwards, the result showing the vector length according to the vector's coordinates will appear in the graph interface .
To continue viewing the vector's angle, click the angle icon in the right-hand sidebar, as shown in the image.
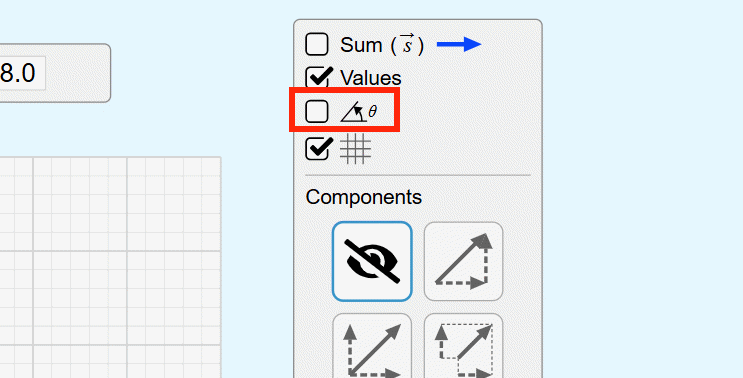
The graphic on the side now shows the angle of the vector as shown below.
Was this article helpful?
Your feedback helps us improve.
Related Articles
 Guide to creating visual simulations using Muse Spark on Meta AI3 minutes read
 Guide to creating realistic working circuit simulations2 minutes read
 Transform experiment images into visual experiments in Canva.3 minutes read
 Create interactive simulations of mathematical concepts on ChatGPT.3 minutes read
 A guide to creating mind maps using AI.4 minutes read
 Create and work with vector graphics in Photoshop15 minutes read
Reader Comments 0
Sign in with email or Google to join the discussion.