Table of Contents
NotebookLM's data-table feature can extract repeated facts from selected sources and organize them into rows and columns. It is useful for comparisons, timelines, inventories and literature notes, but the output is only a draft: verify every important value against the cited source before using or sharing the table.
Prepare sources and define the table
Start with a clear question and a consistent source set. Decide what one row should represent—for example, one product, event, study or person—and list the exact columns you need. A defined schema prevents the table from mixing different kinds of records.
Open NotebookLM, create a notebook and add the source material. The example uses pasted text, but you can use another supported source type when appropriate. Do not upload confidential data unless its use is authorized and consistent with your organization's policy.
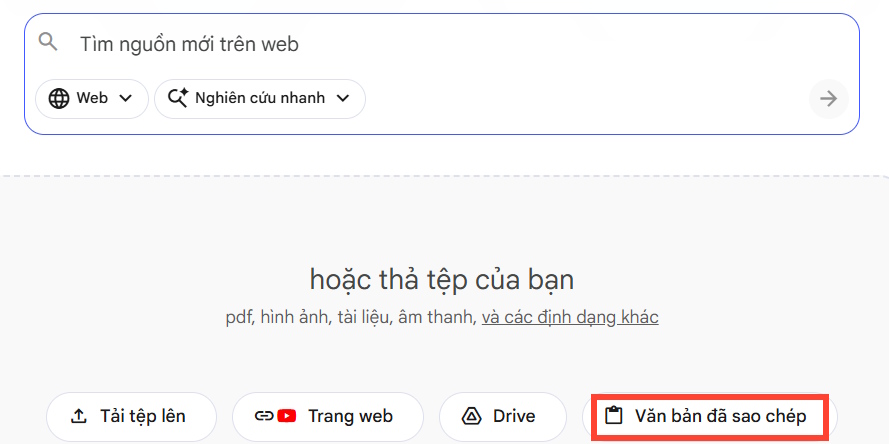
Create the data table
1. Check the imported source
Read NotebookLM's summary to confirm that the correct material was imported. Open several citations and look for missing pages, broken formatting or transcription errors before extracting data.

2. Open the data-table tool
In the Studio area, open the customization control beside the data-table or data-sheet feature. The exact label and icon may vary as NotebookLM changes.
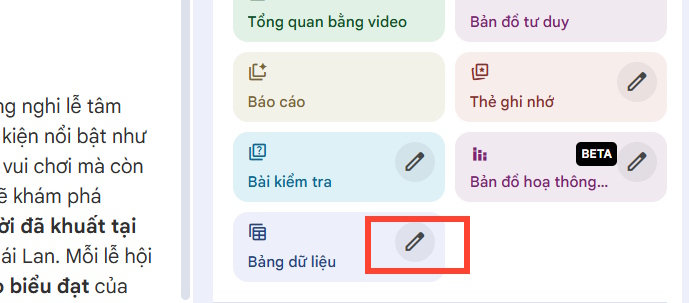
3. Write an extraction instruction
Specify the table's purpose, audience, row definition and columns. State how missing or conflicting information should be handled. For example:
Create a comparison table from the selected sources. Use one row per product. Columns: product name, supported platforms, main feature, stated limitation, price information exactly as written, and source citation. If a value is not stated, write "Not provided." Do not infer missing values.When working with dates or numbers, request a consistent format but preserve the meaning of the source. If several sources disagree, ask for separate values with citations rather than a single blended answer.
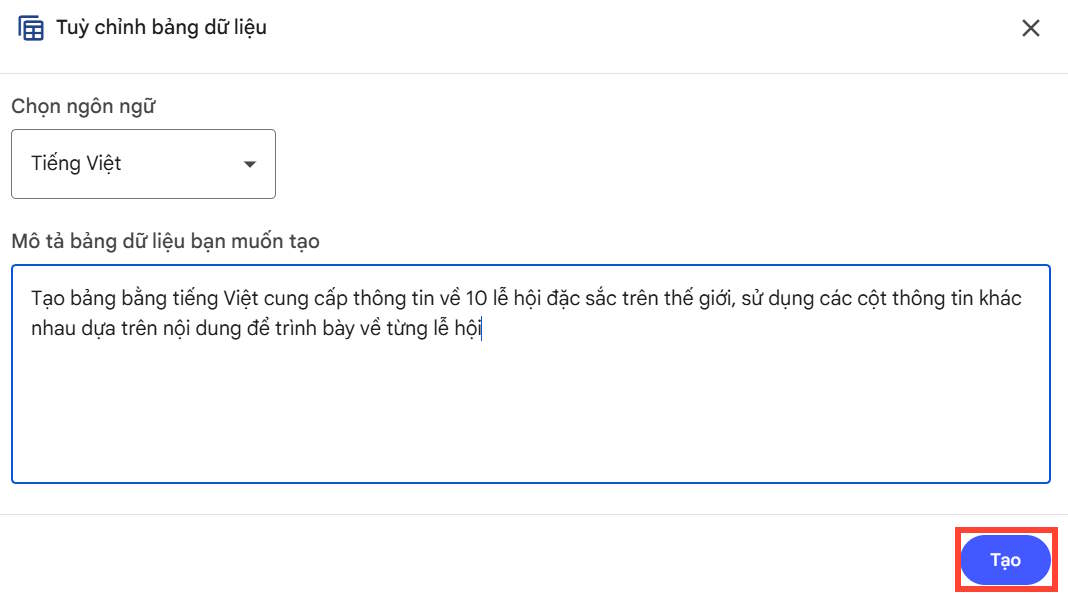
4. Generate and inspect the table
Select Create and open the generated table. Check whether each row represents the same type of item and whether columns contain comparable information. Watch for duplicated entities, merged records, inconsistent units and blank cells that were filled with unsupported guesses.

Follow the citations for a sample of ordinary rows and every high-impact value. For a small table, verify all rows. A polished layout does not guarantee that the extraction is complete or accurate.
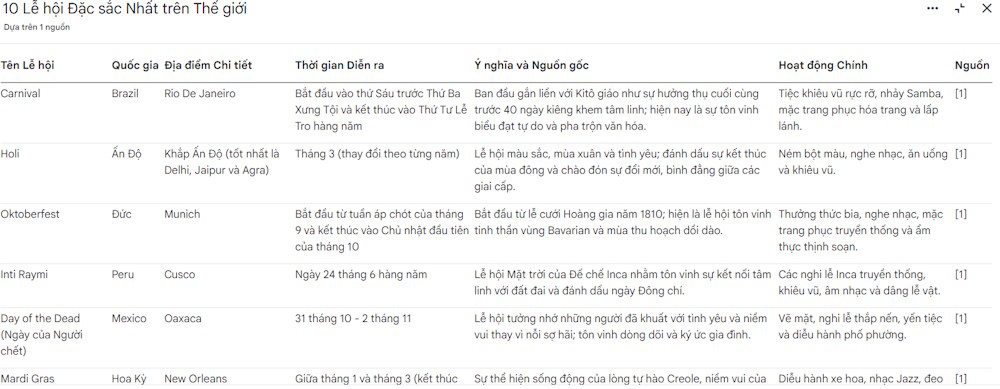
Export the table to Google Sheets
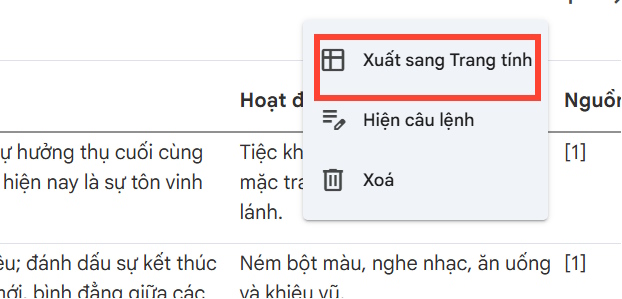
Open the three-dot menu and choose Export to Sheets when that option is available. In Google Sheets, fix data types, standardize units, freeze the header row and add filters if they help readers inspect the data. Preserve a citation or source column so claims remain traceable after export.
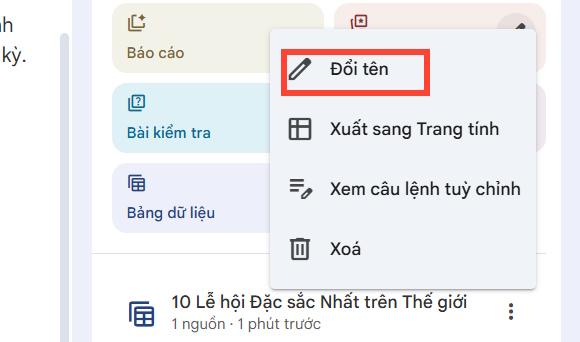
You can also rename the generated table from its item menu. Delete a table only after confirming that no one still needs it and that an exported copy exists when retention is required.
Quality checklist
- One row represents one consistent entity or event.
- Column names are specific and use consistent units.
- Missing values are marked, not invented.
- Conflicting claims remain tied to their individual sources.
- Names, dates, totals and calculations have been checked.
- The exported sheet retains enough source information for verification.
For other Studio outputs and interface changes, see this overview of NotebookLM's newer features. If your project involves broader evidence collection rather than extraction from a fixed source set, compare NotebookLM with these AI research tools.
Related Articles
 NotebookLM's New Feature Makes Researchers' Dreams a Reality8 minutes read
 How to Create Infographics with AI Simply: Step-by-Step Guide7 minutes read
 Guide to Converting Videos into Lectures Using NotebookLM4 minutes read
 Instructions on Converting Videos into Lesson Plans Using NotebookLM4 minutes read
 How to Create Tables, Draw Tables in Word: Step-by-Step5 minutes read
 Steps to Create Relationships Between Multiple Tables Using9 minutes read
Reader Comments 0
Sign in with email or Google to join the discussion.