'Measure' server - Costly but worthwhile
The principle of computer system performance evaluation - or benchmarking - is quite simple: run a simulation of a typical workflow on the system to be evaluated and measure the time to complete this process.
With computer systems for personal users (PC), office applications, graphics programs and games are perfect measures. The benchmarking tool for PC has many, not too expensive (even free) and not too complicated to implement. It only takes a day or a day that you can get benchmark scores to show off or 'compete' with other PC systems.
Benchmarking for servers (servers) is laborious and complex compared to PCs. Hardware and server software with higher capacity, more specialized, benchmarking environments often require more machines (such as hub or switch devices and client computers to create network environments) and need to do a lot of work. complicated installation. Time can take days or weeks.
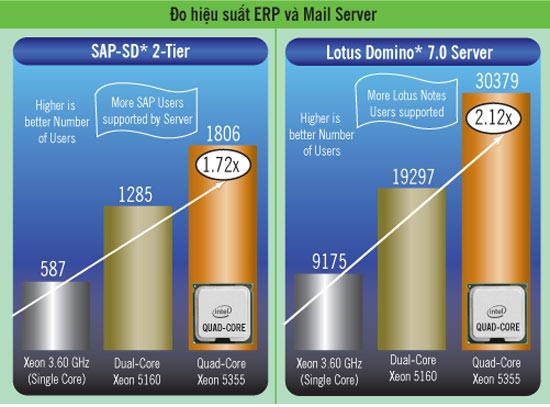
In the past, people were not interested in benchmarking servers because big server vendors had experienced experts who designed the server configuration for specific applications or orders. Currently, the server has become more popular, computer stores and users can also assemble or upgrade servers (adding RAM or CPU), the implementation is as simple as doing with PC, because So there is a need to evaluate server performance to help select the optimal configuration. Many applications on the server are sensitive to system configuration. The benchmark score will help indicate between doubling memory or adding CPU, which element improves the better performance for web server (web server) or server server database (database server). Of course, if you don't have to worry about finance, you can mount multiple CPUs (with a high clock frequency) and increase the memory capacity very high without bothering to benchmark scores. (Figure 1)

Figure 1. Server application sensitive to server hardware configuration ( Source: Intel )
Performance according to the actual application
Just 10 minutes running Windows Media Encore 9, you can imagine the power of a dual-core Pentium D system compared to Pentium 4, but will not know if it runs SAP or SQL Server 2005 applications well. A strongly configured mail server may not run well DOOM 3 (a popular measuring tool for PC) because it is designed to serve email rather than playing games.

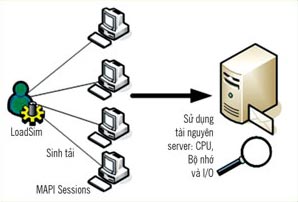
Figure 2. Measuring server performance according to the actual application model
PC benchmarking software cannot accurately evaluate server performance. However, similar to PC, the server is also measured in performance according to two methods: component components and real applications. Method of measuring the performance of components such as memory bandwidth or network card. This method gives theoretical maximum performance scores. It is possible to include some benchmarking tools which are known by this method such as SPECCPU, Sandra, Stream .
The second method simulates real applications to draw a general picture of the server's ability to respond in real working environments. This method is more practical than the first one.
There are a number of benchmarking tools for servers under real applications from well-known software vendors, for example the SAP enterprise solution provider (www.sap.com) with mySAP Business Suite to assess server capabilities. responding to users of ERP (Sales & Distribution - SD) applications; SunGard financial services provider (www.sungard.com) has a credit and risk management tool (Adaptiv Credit Risk - ACR, this tool is used by Intel to evaluate the server's computing capabilities using the suite New multi-core processor recently released). Or Lotus NotesBench tool (www.notesbench.org) simulates the operation between Domino workstation and server and between server and server to evaluate the service capability of IBM Lotus Notes mail server. Microsoft also has the MMB3 tool used to evaluate MS Exchange mail servers and SQLIOStress tools to assess the server's ability to respond to SQL Server databases. (Figure 2)
It is possible to divide 4 groups of benchmarking tools for servers according to the real application :
• Calculation (basic server): Linpack, SunGuard ACR, SysBench, SPECapc / SPECviewperf .
• Web service (low-end server): WebBench, SPECWeb .
• Serving application (medium server): NetBench, MS Exchange MMB3, R6iNotes, SPECjbb, SPECjAppServer .
• Serving database (high-end server): SAP SD, TPC-C / TPC-H .
Virtual performance
Virtualization technology allows multiple operating systems and software applications to run on the same physical server, providing server integration capabilities (multiple virtual servers running on a physical server) to effectively exploit server hardware .

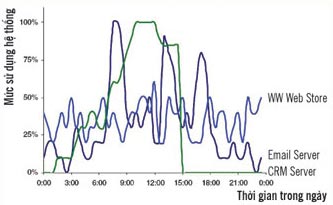
Figure 3. Virtual servers have peak load at different times
Integration helps increase server performance, but increasing how the existing benchmark tools are not measured. Firstly, because the integration creates a situation where the physical server is subject to many different types of loads simultaneously, each type of load has different measurements. Secondly, the use of resources is inconsistent, at which time the application, when other applications use more system resources, creates more peaks at different times. (Figure 3)
For these reasons, Intel, which is promoting the application of virtualization technology for servers, has developed its own vConsolidate Workload tool to evaluate virtualization application performance on the server. This tool can simulate simultaneous downloads of 4 servers: mail, web, applications and databases. vConsolidate Workload (beta) is used internally by Intel to evaluate multi-core processors for servers.
Benchmark, SPEC, is also working with a number of major IT companies (including IBM, Intel, AMD, HP, VMware .) to develop a virtualization performance evaluation method. Information about this project can be found at www.spec.org/specvirtualization.
Performance in watts

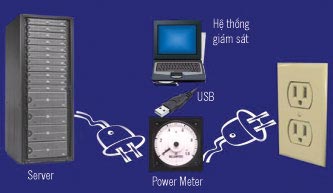
Figure 4. Measuring power consumption is simple and accurate
Once a 'weakness' of high-power systems, power consumption is now an important measure of total cost of ownership (TCO) for servers, especially high-end servers (high capacity and Power consumption is also high). The balance between performance and power consumption is very important for data centers with multiple servers; The amount of electricity saved in a year by hundreds, even thousands of very large servers.
To assess power consumption, the simplest and most accurate way is to measure at the power outlet (Figure 4). The performance per watt of power consumption is calculated as follows: the efficiency of the system divided by the total power consumption measured at the outlet during the performance measurement. This is how Intel uses it to evaluate watt performance for its new multi-core processors.
SPEC is also developing a SPECpower tool to evaluate the power efficiency of a computer system, expected to be released in the first quarter of 2007. This tool will use existing benchmarking applications to "squeeze" the server to work and measure the amount of power that the system consumes.
Scores are priced
While there are some benchmark tools that can work independently, many old tools still need networked client machines to create downloads. This means that you need to set up the network environment to create the load for the server to measure and this creates a cost problem. In addition, while many benchmarking tools for PC are free or quite cheap (only a few tens of dollars), the price of cheap benchmarking tools for servers must be a few hundred dollars (with advanced tools such as SPEC jAppServer2004 and HPC2002, you have to spend up to 2000USD and 3000 USD). Although there is also a free solution like TPC, the implementation is very complicated.
While costly and time-consuming, evaluating server performance is worth its value. How can people sell or invest in server systems worth several thousand to tens of thousands of dollars or more without a score that proves to be really strong!
SPEC AND TPC
Two of the most well-known names in the field of benchmarking for servers, each goes a different way but has the same goal.
SPEC
SPEC (Standard Performance Evaluation Corporation) is one of the most well-known names in benchmarking (for both server and PC). SPEC has many benchmarking tools used to evaluate from computing power, server service capability to power consumption. The SPEC CPU2006 tool (the latest version) is used to evaluate the CPU's integer and real-time computing performance, which can help server providers determine whether to use Opteron or Xeon processors, or switch to dual-processor processors. SPECjbb2005 is quite good for evaluating server performance in the model of 3-level client-server application (popular web application model) on Java platform. This tool has the ability to create downloads without the need for client machines. According to SPEC, the benchmark tool can also be used to measure CPU performance, memory and load capacity of multi-processor systems.
SPEC also has some tools for evaluating other server application models. SPECweb2005 allows evaluating web server performance. MAIL2001 performs the same function as the mail server. SPEC jAppServer2004 is another Java-based measurement tool designed to measure the performance of J2EE application servers. And a group of HPC (High Performance Computing) measuring tools is used to measure high-performance server cluster performance.
Some SPEC tools still need networked clients to load and price of SPEC tools from a few hundred to a few thousand dollars or more. Details of SPEC's tools can be found at www.spec.org.
TPC
Alternatively, you can follow the free path using TPC benchmarking method: TPC-App, TPC-C or TPC-H. TPC-App is used to evaluate servers serving applications and web services, simulating the activities of B2B transactions (businesses with businesses). TPC-C is used to evaluate servers serving databases with online transactions, simulating order processing activities. TPC-H is used to evaluate business data analysis systems that support decision making.
TPC measurements are probably the most difficult measurements. There is no .exe program at all. Instead, TPC offers technical specifications (completely free) for each measurement. Documents over 100 pages (available on the website www.tpc.org) provide the requirements of each measurement.
TPC is a non-profit organization consisting of 24 members.Results from TPC measurements require verification before publication.If a server provider gives a benchmark score according to TPC measurements that others cannot replicate, they can sue.Thus, published TPC scores are always truthful and allow to compare this server to the other server correctly.
Phuong Uyen
You should read it
- ★ 11 best MySQL monitoring tools for adjusting and managing SQL Server performance
- ★ Balancing download of Exchange 2007 SP1 Hub Transport servers with Windows Network Load Balancing (Part 1)
- ★ Learn about different types of RAM servers
- ★ [Theory] What is Proxy Server?
- ★ 5 reasons why you should avoid free proxy servers