Adjust performance in SQL Server: find slow queries
Adjusting SQL performance is a never-ending battle. This article will provide some tips for you to find slow SQL queries and perform performance tuning in SQL Server.
Table of Contents
Adjusting SQL performance is a never-ending battle. This article will provide some tips for you to find slow SQL queries and perform performance tuning in SQL Server.
1. Find slow queries with DMV of SQL
One of the great features of SQL Server is the built-in Dynamic Management Views (DMVs). These dynamic management modes provide a lot of information about different issues.
There are some DMVs that provide data about query statistics, execution plans, recent queries, and more. Some DMVs can be used together to provide some important details.
For example, the following query is used to find queries with most read, write, uptime (CPU), etc.
SELECT TOP 10 SUBSTRING ( qt . TEXT , ( qs . Statement_start_offset / 2 ) + 1 , (( CASE qs . Statement_end_offset WHEN - 1 THEN DATALENGTH ( qt . TEXT ) ELSE qs . Statement_end_offset END - qs . Statement_start_offset ) / 2 ) + 1 ), qs . execution_count , qs . total_logical_reads , qs . last_logical_reads , qs . total_logical_writes , qs . last_logical_writes , qs . total_worker_time , qs . last_worker_time , qs . total_elapsed_time / 1000000 total_elapsed_time_in_S , qs . last_elapsed_time / 1000000 last_elapsed_time_in_S , qs . last_execution_time , qp . query_plan FROM sys . dm_exec_query_stats qs CROSS APPLY sys . dm_exec_sql_text ( qs . sql_handle ) qt CROSS APPLY sys . dm_exec_query_plan ( qs . plan_handle ) qp ORDER BY qs . total_logical_reads DESC - logical reads - ORDER BY qs . total_logical_writes DESC - logical writes - ORDER BY qs . total_worker_time DESC - CPU time
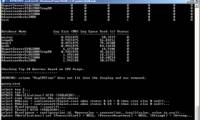
The result of the query will look like the image below. You can see that the query at the top occupies all the resources.
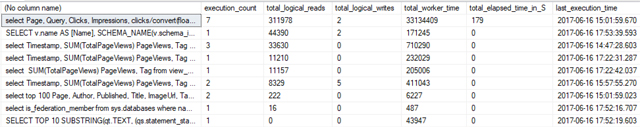
From this result, we can copy that SQL query and consider performance improvement measures such as adding an index, etc.
Advantages: Always give aggregate statistics.
Disadvantages: Don't let the user know what's calling the query and can't imagine when queries are invoked over time.
2. Report queries through APM solutions
One of the great features of the application performance management tool (APM) is the ability to track SQL queries. For example, Retrace tracks SQL queries across multiple database providers, including SQL Server.
Retrace can tell users how many queries have been performed, average query execution time and queries that are calling queries. These are really valuable information for adjusting SQL performance.
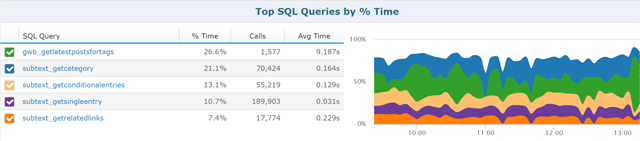
APM solutions collect data by creating low performance for application code when running. Below is a screenshot from the application control panel of Retrace, showing that a specific application has the most SQL query time.
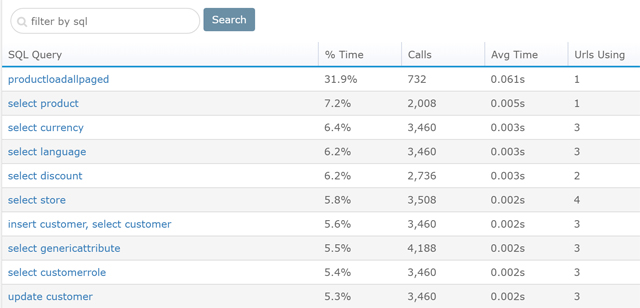
Retrace collects performance statistics about each SQL query executed. You can search for specific queries to find potential problems.
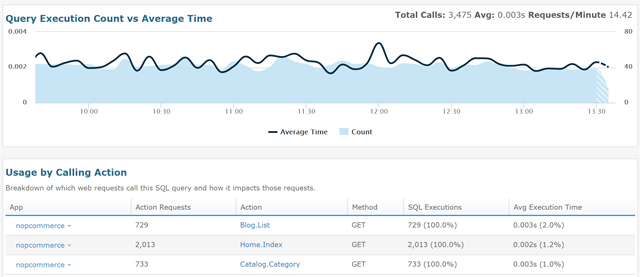
By selecting a specific query, you can see how often that query was invoked by the time and query execution time. In addition, you can also view websites that use SQL queries and good factors that affect performance.
Because Retrace is a tool to write code and track ASP.NET request objects, it can even provide all information about the operation of the code.
The image below shows all SQL queries and other detailed information about code operations. Retrace can even display log messages in the same view. In addition, it shows the server address, the query database name being executed and how many records are returned.
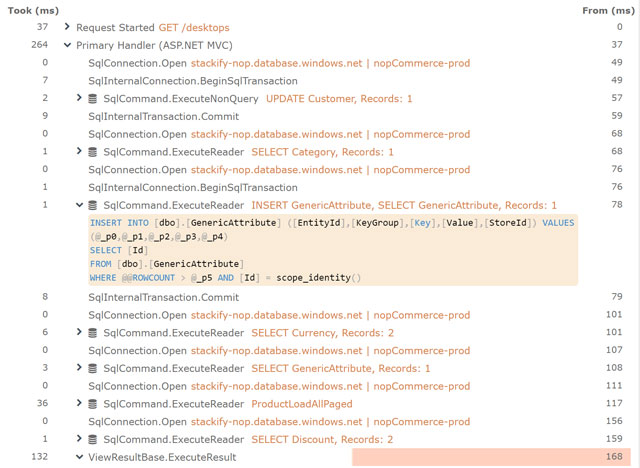
Retrace provides comprehensive SQL information and many tracking and warning features about SQL queries.
Advantages : Provide detailed reports on each application and each query. Can show detailed transactions how queries are used for only $ 10 a month.
Disadvantages: Does not provide read or write numbers for each query.
3. SQL Server Profiler
SQL Server Profiler is a useful logging tool if you want to see how SQL queries are executed in real-time databases. SQL Profiler records detailed events about interacting with SQL Server.
- Connect login, disconnect login and cannot connect
- SELECT, INSERT, UPDATE, DELETE statements
- RPC procedural package call status calls
- Start and end the Stored Procedure
- Start and end the Stored Procedure commands.
- Open and end an SQL command package
- Error recorded in the error log of SQL Server
- A lock is purchased or released on a database object
- Open pointer data type
- Check for security permissions

You can read the Database Monitoring article with SQL Profiler to know how to use SQL Server Profiler.
Advantages: provide detailed data information.
Disadvantages: Users must activate this tool manually.
4. SQL Server Extended Events
SQL Profiler has been replaced with SQL Server Extended Events, which has frustrated many users. Extended Events operate through Event Tracing (ETW), which is a common way that Microsoft does for all of its technologies to deliver diagnostic data.
ETW offers much more flexible features. As a developer, you can easily touch ETW events from SQL Server to collect data for custom purposes.

Advantages : Easy to activate and run.
Disadvantages: Because this tool is quite new, not many people know about it.
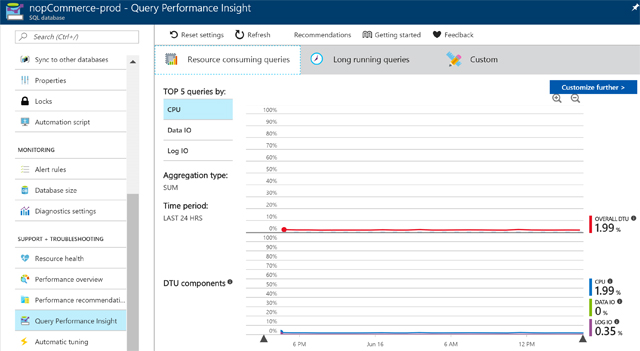
5. Query Performance Insight for SQL Azure database
In the Azure Portal, you can access a variety of useful performance reports and optimization tips.
Note: These reports are only available for databases stored on SQL Azure.
In the screenshot below, you can see that SQL Azure easily uses queries that use most CPU, Data IO and Log IO. In addition, there are some excellent basic reports built in.
You can also choose a specific query to get detailed information that helps adjust SQL performance.
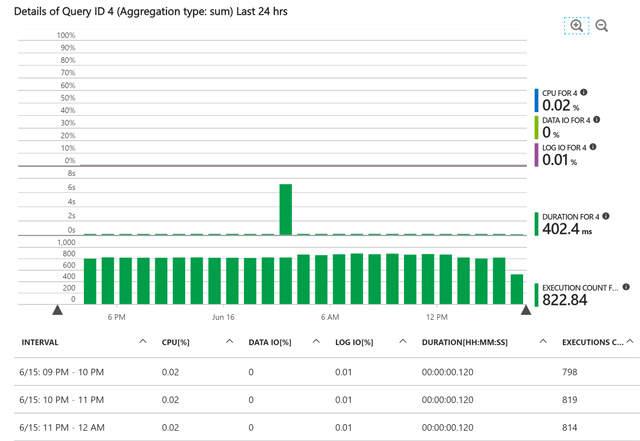
Advantages : Provide detailed basic information.
Disadvantages: Only works on Azure, not reported on multiple databases.
See more:
- Install SQL Server 2008
- Install SQL server 2016 from the Installation Wizard (Setup)
- Segment tables in SQL Server
Was this article helpful?
Your feedback helps us improve.
Related Articles
 Capture execution diagrams with SQL Server 2005 Profiler5 minutes read
 How to Check the Query Performance in an SQL Server5 minutes read
 Find User in SQL Server3 minutes read
 Find Login in SQL Server4 minutes read
 6 Free Windows Tools to Find Out What's Slowing Down Your Computer6 minutes read
 Test SQL Server with Windows PowerShell - Part 77 minutes read
Reader Comments 0
Sign in with email or Google to join the discussion.