Table of Contents
You can generate an illustrative image from the Gemini side panel in Google Sheets and insert a result into the spreadsheet. This is useful for a cover sheet, product mockup or visual label. It is not a substitute for a chart that accurately represents the numbers in your cells.
Generate an image in Sheets
- Open a native Google Sheets file on a computer and select Ask Gemini at the top right. Access depends on your Google Workspace plan and account settings; an Excel-format file may need to be saved as Google Sheets first.
- In the side panel, write a specific image request. For example: “Create a simple flat illustration of a reusable water bottle on a pale background, with no text, suitable for a product inventory sheet.”
- Review the suggested images. Hover over one to select Insert, or use Generate more or Edit prompt if it does not fit.
- After insertion, position and size the image so it does not obscure data or controls. Add a descriptive label or nearby text for readers who need context.
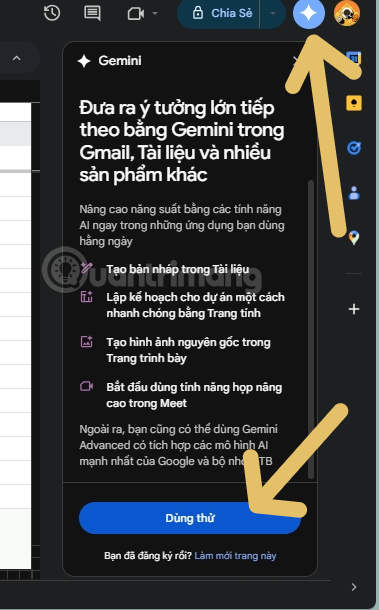
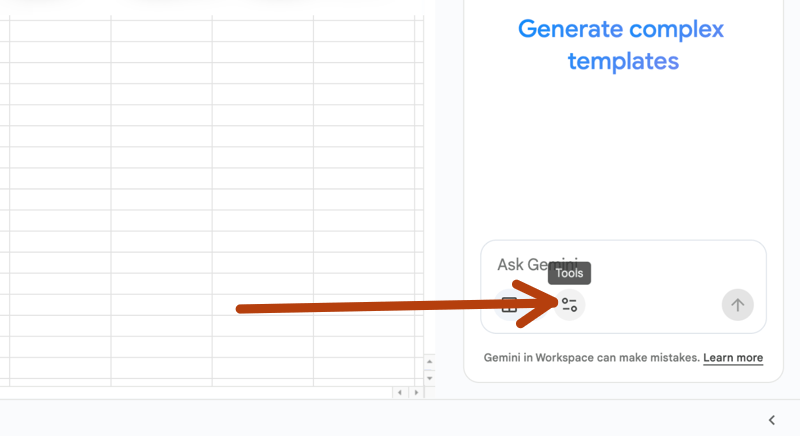
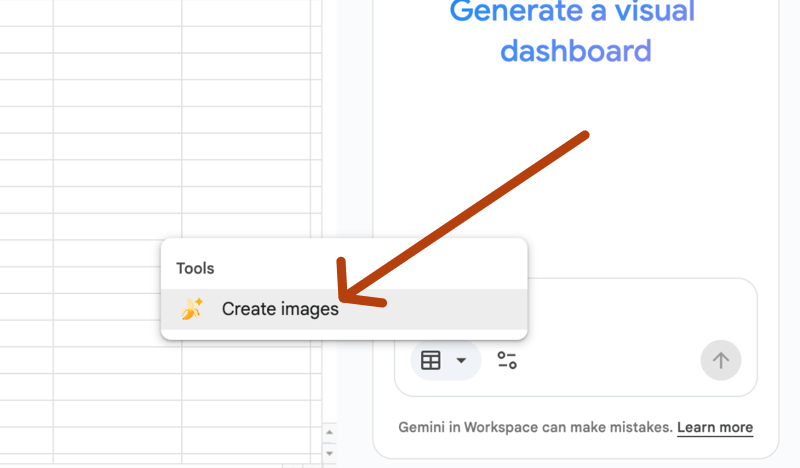

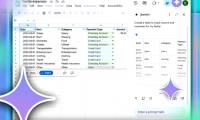
These screenshots show a Tools > Create Images route in an earlier interface. Google's current Sheets help describes prompting directly in the Gemini side panel; follow the controls your account displays. If Gemini is missing, check eligibility and whether an administrator has enabled it. Our Gemini in Sheets overview covers other supported tasks.
Choose the right visual for the job
A generated image can establish a theme or illustrate an object, but it may contain inaccurate details or garbled text. Do not use it to imply a product feature, measurement or finding that you have not verified. For sales trends or budget comparisons, build a chart from the sheet's data instead; see our Gemini chart guide. Review data ranges and axes when using an AI-generated chart.
Keep the prompt focused on subject, style, framing and intended use. Check any organization's image-use policy and the result's suitability before sharing a report externally.
Related Articles
 minutes read
 The Gemini Prompt Creates Black and White Images in the Style of Film Noir9 minutes read
 Gemini Can Do More Than You Think in Google Sheets: Complete Guide6 minutes read
 Instructions on Creating Automated Exam Scoring Sheets Using Gemini1 minutes read
 How to Download Games Created on Gemini4 minutes read
 How to Create Games on Gemini Extremely Quickly4 minutes read
Reader Comments 0
Sign in with email or Google to join the discussion.