Linear graphs in Machine Learning
Machine learning often uses line graphs to represent relationships. A line graph displays the values of a linear function: y = ax + b..
Machine learning often uses line graphs to represent relationships.
The line graph shows the values of a linear function: y = ax + b
Keywords:
- Linear
- Slope (Corner)
- Intercept (Starting value)
Linear
Linear means straight. A linear graph is a straight line.
The graph consists of two axes: the x-axis (horizontal) and the y-axis (vertical).
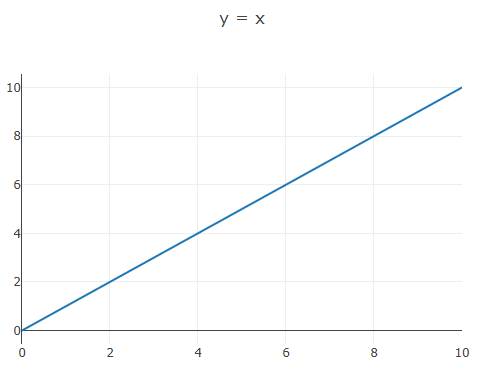
For example:
const xValues = []; const yValues = []; // Generate values for (let x = 0; x <= 10; x += 1) { xValues.push(x); yValues.push(x); } // Define Data const data = [{ x: xValues, y: yValues, mode: "lines" }]; // Define Layout const layout = {title: "y = x"}; // Display using Plotly Plotly.newPlot("myPlot", data, layout);Slope
Slope is the angle of a graph.
Slope is the value of 'a' in the linear graph: y = ax
In this example, slope = 1.2:
For example:
let slope = 1.2; const xValues = []; const yValues = []; // Generate values for (let x = 0; x <= 10; x += 1) { xValues.push(x); yValues.push(x * slope); } // Define Data const data = [{ x: xValues, y: yValues, mode: "lines" }]; // Define Layout const layout = {title: "Slope=" + slope}; // Display using Plotly Plotly.newPlot("myPlot", data, layout);Intercept
Intercept is the starting value of the graph.
Intercept is the value of b in the linear graph: y = ax + b
In this example, slope = 1.2 and intercept = 7:
For example:
let slope = 1.2; let intercept = 7; const xValues = []; const yValues = []; // Generate values for (let x = 0; x <= 10; x += 1) { xValues.push(x); yValues.push(x * slope + intercept); } // Define Data const data = [{ x: xValues, y: yValues, mode: "lines" }]; // Define Layout const layout = {title: "Slope=" + slope + " Intercept=" + intercept}; // Display using Plotly Plotly.newPlot("myPlot", data, layout);