javascript sample code
-
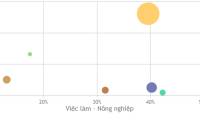
 JavaScript code to create a zoomable chart with Zoom & Pan functionality.
the example below illustrates a bubble chart template created using javascript that features chart zoom and rotation capabilities.
JavaScript code to create a zoomable chart with Zoom & Pan functionality.
the example below illustrates a bubble chart template created using javascript that features chart zoom and rotation capabilities.
-
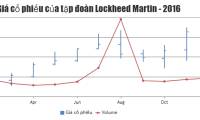
JavaScript code to create OHLC and line chart combo chart template
the example below illustrates a sample of the 2016 lockheed martin stock price chart with the number of shares by combining the ohlc and line graphs.
-
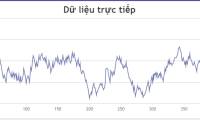
JavaScript code to create dynamic charts/graphs
the example below illustrates a dynamic chart template created with javascript. this javascript sample code for a live data updated chart template.
-
JavaScript code to generate dynamic line graphs/charts
the example below illustrates a line chart template created with javascript. it updates data every 500 milliseconds. the article also provides source code for you to edit in the browser or save to your computer to run locally.
-
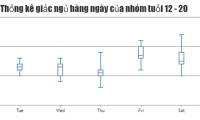
JavaScript code to generate box and whisker charts/graphs
the example below illustrates a box and whisker chart/graph template created with javascript. the article also provides the source code for you to edit in the browser and save to your computer to run locally.
-
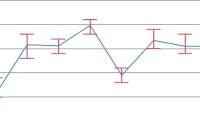
JavaScript code to generate error line graph/graph
the example below illustrates a sample error chart with line chart created with javascript. the article also provides source code for you to edit in the browser or save to your computer to run locally.
-
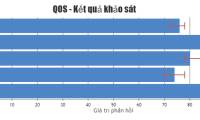
Code of chart/bar graph with error combination
the example below illustrates a bar chart template with errors created with javascript.
-
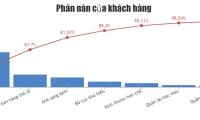
JavaScript code that generates Pareto chart template with Index/Data . label
you can easily add and customize index/data labels to the pareto chart. the example below shows a pareto chart with data/index labels created with javascript.