Guide to creating compelling document reports using Gemini
Gemini offers you various data processing modes, such as the Canvas mode, to create more dynamic and intuitive document reports through the use of charts and images..
Gemini offers various data processing modes, such as the Canvas mode, to create more dynamic and intuitive document reports using charts and images. Simply provide a description of what you need to do, and Gemini will quickly process the content to deliver high-quality results. Below is a guide on creating document reports using Gemini.
How to create dynamic document reports using Gemini
Step 1:
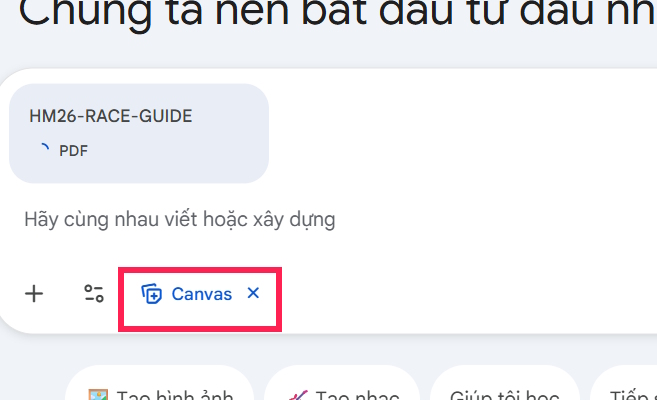
First, we need to switch to Canvas mode on Gemini to use it, then upload the data you need to summarize .
Step 2:
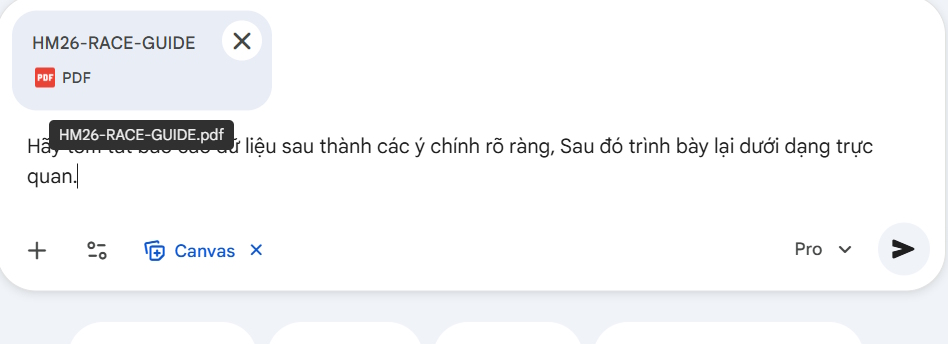
Next, we enter the following data summary command to obtain the most visually appealing report.
Here are some examples of report generation prompts in Gemini.
1. Hãy tóm tắt báo cáo dữ liệu sau thành các ý chính rõ ràng. Sau đó trình bày lại dưới dạng trực quan, bao gồm: Bullet points dễ đọc Bảng so sánh (nếu có số liệu) Gợi ý biểu đồ phù hợp (bar chart, line chart, pie chart.) Highlight các insight quan trọng 2. Bạn là chuyên gia phân tích dữ liệu. Hãy đọc báo cáo sau và thực hiện: Tóm tắt nội dung chính (ngắn gọn, dễ hiểu) Phân tích xu hướng và insight quan trọng Đề xuất cách trực quan hóa dữ liệu (loại biểu đồ + lý do) Trình bày lại như một báo cáo sinh động, có storytelling, dễ trình bày cho người không chuyên 3. Hãy đóng vai nhà phân tích kinh doanh. Tóm tắt báo cáo dưới đây và: Nêu KPI chính So sánh theo thời gian / khu vực / sản phẩm Chỉ ra điểm mạnh, điểm yếu Đề xuất biểu đồ trực quan phù hợp Kết luận ngắn gọn dạng executive summary 4. Hãy chuyển báo cáo sau thành nội dung slide PowerPoint: Mỗi slide 1 ý chính Có tiêu đề rõ ràng Gợi ý hình ảnh/biểu đồ cho từng slide Ngắn gọn, trực quan, dễ trình bàyStep 3:
As a result, we will see a summary of the data uploaded by the user and the process of generating a data report based on the user's request.
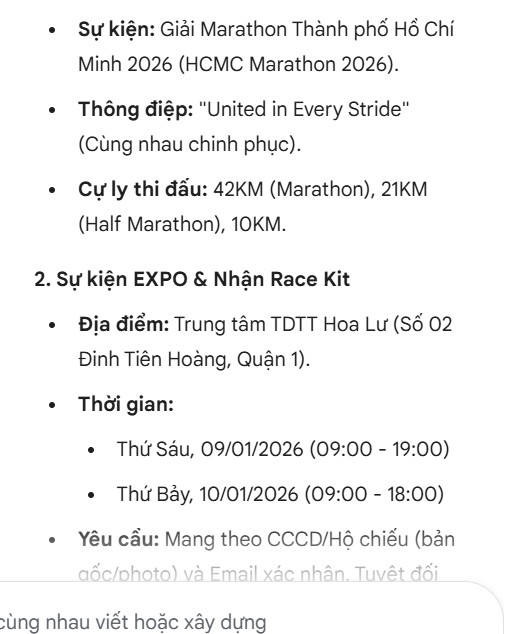
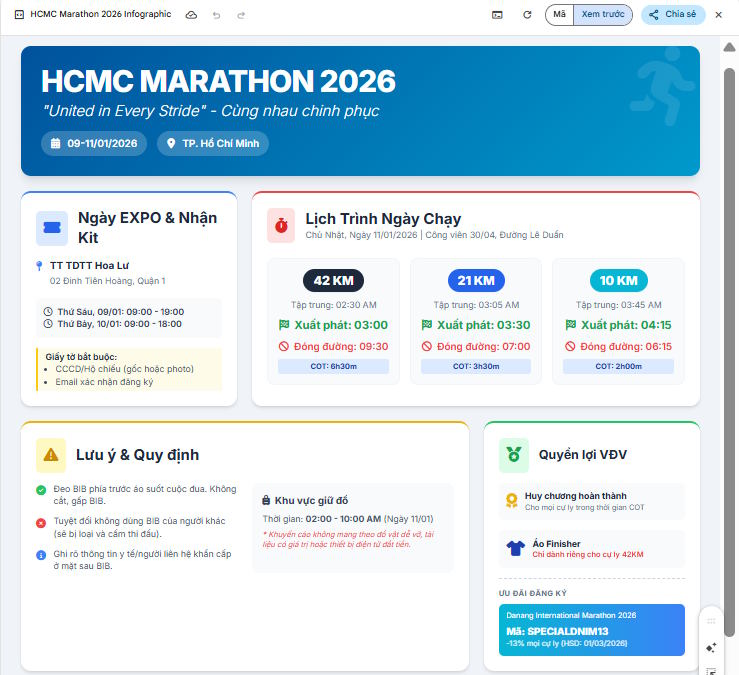
Looking to the side, you'll see a data report with content presented in a more visually appealing format, featuring time-series charts and concise summaries of key points compared to the original data.
If you need to change any part of the content, re-enter the command describing the change or add that part to the report.
To download the data report generated on Gemini, please refer to the article below.
- Instructions on how to download games created on Gemini
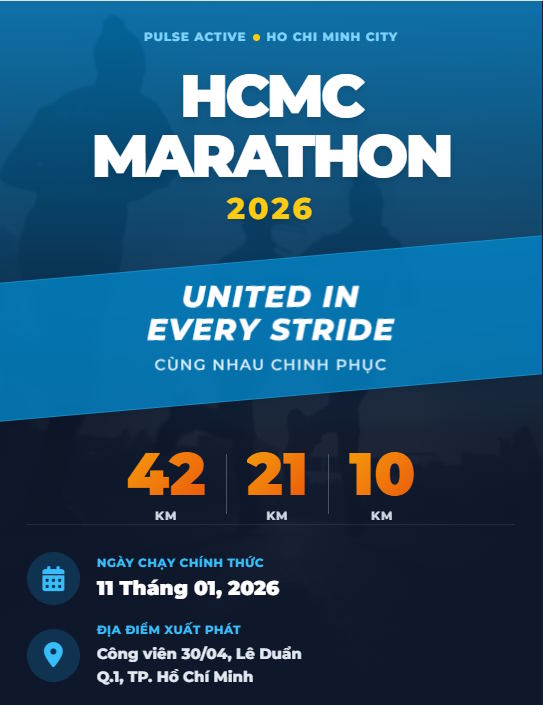
In addition to requesting the creation of a data report in Canva, you could also request the creation of a promotional poster for this event, for example.