How to Make a Map Using Leaflet
Leaflet is an easy-to-use and fairly powerful JavaScript tool that enables us to create and display maps on a website. This article will guide you in setting up Leaflet, and then building a simple map that has a tile layer from Mapbox and....
Part 1 of 2:
Setting Up the Map
-
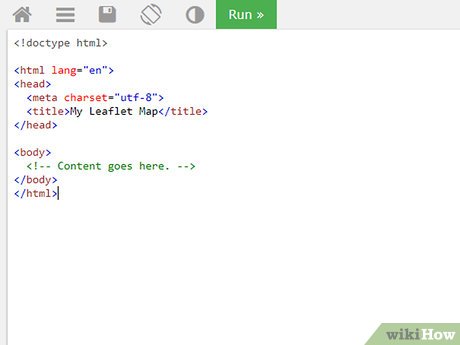 Open or create your webpage. If you don't already have a webpage you want to insert the map into, you can use the following HTML5 template; save it as 'map_page.html' :
<html lang="en"> <head> <meta charset="utf-8"> <title>My Leaflet Maptitle> head> <body> body> html>
-
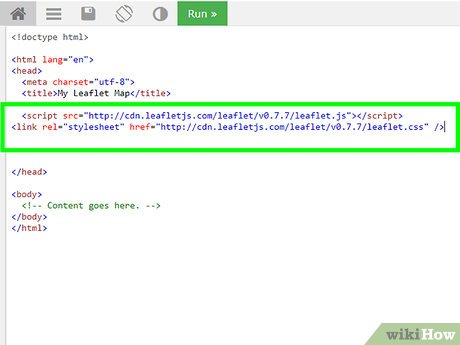 Include the Leaflet JavaScript and CSS files. Your webpage will need to include the Leaflet JavaScript file and CSS file. To do this, paste the following line of code into your HTML file, inside the
area, on a new line below the:<script src="http://cdn.leafletjs.com/leaflet/v0.7.7/leaflet.js">script> <link rel="stylesheet" href="http://cdn.leafletjs.com/leaflet/v0.7.7/leaflet.css" />
-
 Add an HTML map container. Leaflet will display the map inside an HTML element, so you need to provide one for it. Paste the following line of markup inside the
:<div id="map">div>
-
 Style the map container. You need to set how large the map will be when it is displayed, and you should use CSS to do this. You can add the following to the document
:<style> #map { height: 500px; width: 700px; } style>
-
 Create the map object. To start writing the JavaScript code that sets up the map, you'll need to add a
area to theafter the map containerdiv. Also inside of this, you can create the map object by calling themap()function of the leaflet object, like this:<script type='text/javascript'> var map = L.map('map'); </script>
-
 Set the map's view. A Leaflet map's view property is what manages what part of of the map you see. Set your map's view to center on the coordinates [0, 0] (off the coast of central Africa):
- Note: Unlike the OpenLayers mapping library, Leaflet deals with coordinates in the format [latitude, longitude].
map.setView([0, 0], 2);
-
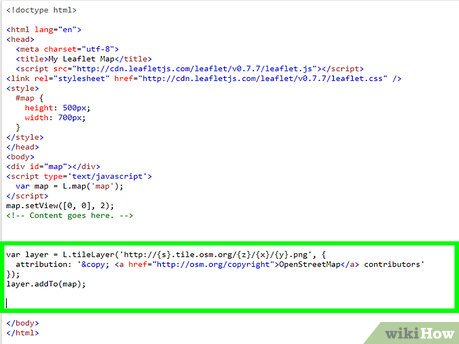 Add a tile layer. Leaflet maps have layers which are stacked on top of one another, and are what you actually see in a map. There are several types of layers: UI (markers and popups), Raster (tile layers), Vector (shapes), and Other. Tile layers are are the standard 'base' layers, and can come from map providers like Google Maps, MapQuest, or OpenStreetMaps. Each layer has a urlTemplate, which tells Leaflet where the layer information is coming from. You should also provide attribution information to tell visitors where the map tiles are from.
var layer = L.tileLayer('http://{s}.tile.osm.org/{z}/{x}/{y}.png', { attribution: '© OpenStreetMap contributors' }); layer.addTo(map);
Part 2 of 2:
Adding Additional Layers and Features
-
 Add a marker. Markers show the location of a point on a map. In Leaflet, markers are a type of 'UI layer', so they can be directly added to maps. Simply copy the following line of code into your
element:.var marker = L.marker([20, 20]); marker.addTo(map);
-
 Add a popup. Popups are used to add contextual information to a marker or other layer.
marker.bindPopup('Chad'); marker.openPopup();
-
 Add a polyline. In Leaflet, a polyline is a line with multiple segments, and is a type of 'vector layer'.
var polyline = L.polyline([ [20, 10], [10, 20], [20, 30] ]) polyline.addTo(map);
-
 Set the style of a vector layer. Styles determine what the vector looks like, and include line colour, line style, fill colour, opacity, and so on. Different style options apply to different types of vectors; for instance, a polyline has no area, so the fill options don't apply.
polyline.setStyle({ color: 'red' });
-
 Add a scale control. Controls let you interact with the map in various ways, or show additional information about the map. A scale control displays how large distances are on the map, which changes when the map is zoomed.
var scale = L.control.scale() scale.addTo(map);
-
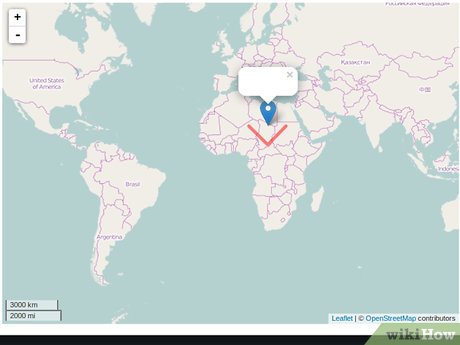 Review the finished map.