How to install Grafana on Alma Linux
Grafana is a free, open source monitoring and data visualization software. By default, it supports Graphite, Elasticsearch, Prometheus and other databases.
Table of Contents
Grafana is a free, open source monitoring and data visualization software. By default, it supports Graphite, Elasticsearch, Prometheus and other databases. This is a cross-platform interactive application that provides charts, graphs, and alerts on the web when connected to supported data sources. It is written in Go and TypeScript, supporting many operating systems such as Linux, Windows and macOS.
This article explains how to install Grafana on Alma Linux 8.
Prerequisites
- A server running Alma Linux 8.
- A valid domain name pointing to your server IP.
- The root password is configured on the server.
Install Grafana on Alma Linux
By default, Grafana is not included in the default Alma Linux repository, so you will need to create the Grafana repository manually. You can create it with the following command:
nano /etc/yum.repos.d/grafana.repoAdd the following lines:
[grafana] name=grafana baseurl=https://packages.grafana.com/oss/rpm repo_gpgcheck=1 enabled=1 gpgcheck=1 gpgkey=https://packages.grafana.com/gpg.key sslverify=1 sslcacert=/etc/pki/tls/certs/ca-bundle.crtSave and close the file when you are done and install the Grafana server with the following command:
dnf install grafana -yOnce the Grafana server is installed, check the Grafana package information with the following command:
rpm -qi grafanaYou will get the following output:
Name : grafana Version : 8.4.6 Release : 1 Architecture: x86_64 Install Date: Friday 15 April 2022 09:11:57 AM UTC Group : default Size : 251112361 License : AGPLv3 Signature : RSA/SHA256, Monday 04 April 2022 10:04:18 AM UTC, Key ID 8c8c34c524098cb6 Source RPM : grafana-8.4.6-1.src.rpm Build Date : Monday 04 April 2022 10:03:45 AM UTC Build Host : 6c96bd4ba151 Relocations : / Packager : contact@grafana.com Vendor : Grafana URL : https://grafana.com Summary : Grafana Description : Grafana
Now, Grafana is installed on Alma Linux 8 and you can move on to the next step.
Manage Grafana services
Service Grafana is managed by systemd. You can start the Grafana service with the following command and enable it to start when the system is restarted:
systemctl start grafana-server systemctl enable grafana-serverTo check the status of Grafana, execute the following command:
systemctl status grafana-serverYou will get the status of the Grafana service in the following output:
? grafana-server.service - Grafana instance Loaded: loaded (/usr/lib/systemd/system/grafana-server.service; disabled; vendor preset: disabled) Active: active (running) since Fri 2022-04-15 09:12:37 UTC; 15s ago Docs: http://docs.grafana.org Main PID: 12120 (grafana-server) Tasks: 8 (limit: 11412) Memory: 31.6M CGroup: /system.slice/grafana-server.service ??12120 /usr/sbin/grafana-server --config=/etc/grafana/grafana.ini --pidfile=/var/run/grafana/grafana-server.pid --packaging=rpm c> Apr 15 09:12:37 linux grafana-server[12120]: logger=sqlstore t=2022-04-15T09:12:37.25+0000 lvl=info msg="Created default organization" Apr 15 09:12:37 linux grafana-server[12120]: logger=plugin.manager t=2022-04-15T09:12:37.3+0000 lvl=info msg="Plugin registered" pluginId=inp> Apr 15 09:12:37 linux grafana-server[12120]: logger=plugin.finder t=2022-04-15T09:12:37.3+0000 lvl=warn msg="Skipping finding plugins as dire> Apr 15 09:12:37 linux grafana-server[12120]: logger=query_data t=2022-04-15T09:12:37.3+0000 lvl=info msg="Query Service initialization" Apr 15 09:12:37 linux grafana-server[12120]: logger=live.push_http t=2022-04-15T09:12:37.31+0000 lvl=info msg="Live Push Gateway initializati> Apr 15 09:12:37 linux grafana-server[12120]: logger=server t=2022-04-15T09:12:37.46+0000 lvl=info msg="Writing PID file" path=/var/run/grafan> Apr 15 09:12:37 linux systemd[1]: Started Grafana instance. Apr 15 09:12:37 linux grafana-server[12120]: logger=http.server t=2022-04-15T09:12:37.47+0000 lvl=info msg="HTTP Server Listen" address=[::]:> Apr 15 09:12:37 linux grafana-server[12120]: logger=ngalert t=2022-04-15T09:12:37.47+0000 lvl=info msg="warming cache for startup" Apr 15 09:12:37 linux grafana-server[12120]: logger=ngalert.multiorg.alertmanager t=2022-04-15T09:12:37.47+0000 lvl=info msg="starting MultiO>At this point, Grafana is started and listening on port 3000. You can check this with the following command:
ss -antpl | grep 3000You will get the Grafana listening port in the following output:
LISTEN 0 128 *:3000 *:* users:(("grafana-server",pid=12120,fd=9))Configure Nginx as a reverse proxy
Next, you need to install Nginx and configure it as a reverse proxy for Grafana. First, run the following command to install the Nginx server:
dnf install nginx -yAfter Nginx is installed, create a configuration file for the Nginx virtual host:
nano /etc/nginx/conf.d/grafana.confAdd the following lines:
server { server_name grafana.example.com; listen 80 ; access_log /var/log/nginx/grafana.log; location / { proxy_pass http://localhost:3000; proxy_set_header Host $http_host; proxy_set_header X-Forwarded-Host $host:$server_port; proxy_set_header X-Forwarded-Server $host; proxy_set_header X-Forwarded-For $proxy_add_x_forwarded_for; } }Save and close the file, check the Nginx configuration file with the following command:
nginx -tIf everything is fine, you will get the following output:
nginx: the configuration file /etc/nginx/nginx.conf syntax is ok nginx: configuration file /etc/nginx/nginx.conf test is successfulNext, you need to reload the Nginx service for the configuration changes to be applied:
systemctl restart nginxYou can check the status of Nginx with the following command:
systemctl status nginxYou will see Nginx status in the following output:
? nginx.service - The nginx HTTP and reverse proxy server Loaded: loaded (/usr/lib/systemd/system/nginx.service; disabled; vendor preset: disabled) Drop-In: /usr/lib/systemd/system/nginx.service.d ??php-fpm.conf Active: active (running) since Fri 2022-04-15 09:14:40 UTC; 4s ago Process: 14064 ExecStart=/usr/sbin/nginx (code=exited, status=0/SUCCESS) Process: 14063 ExecStartPre=/usr/sbin/nginx -t (code=exited, status=0/SUCCESS) Process: 14061 ExecStartPre=/usr/bin/rm -f /run/nginx.pid (code=exited, status=0/SUCCESS) Main PID: 14066 (nginx) Tasks: 2 (limit: 11412) Memory: 3.7M CGroup: /system.slice/nginx.service ??14066 nginx: master process /usr/sbin/nginx ??14067 nginx: worker process Apr 15 09:14:39 linux systemd[1]: Starting The nginx HTTP and reverse proxy server. Apr 15 09:14:40 linux nginx[14063]: nginx: the configuration file /etc/nginx/nginx.conf syntax is ok Apr 15 09:14:40 linux nginx[14063]: nginx: configuration file /etc/nginx/nginx.conf test is successful Apr 15 09:14:40 linux systemd[1]: nginx.service: Failed to parse PID from file /run/nginx.pid: Invalid argument Apr 15 09:14:40 linux systemd[1]: Started The nginx HTTP and reverse proxy server.Now, Nginx is installed and configured as a reverse proxy for Grafana. Now, you can proceed to the next step.
Firewall configuration
Next, you need to allow HTTP through the firewall. You can enable it with the following command:
firewall-cmd --add-port=80/tcp --permanentNext, you need to reload the firewall to apply the configuration changes:
firewall-cmd --reloadAccess the Grafana dashboard
Now, open your web browser and access the Grafana dashboard via the URL http://grafana.example.com. You will see the Grafana login page:

Enter the default username admin and password admin , click the Login button . You will be prompted to set a new password (see below):

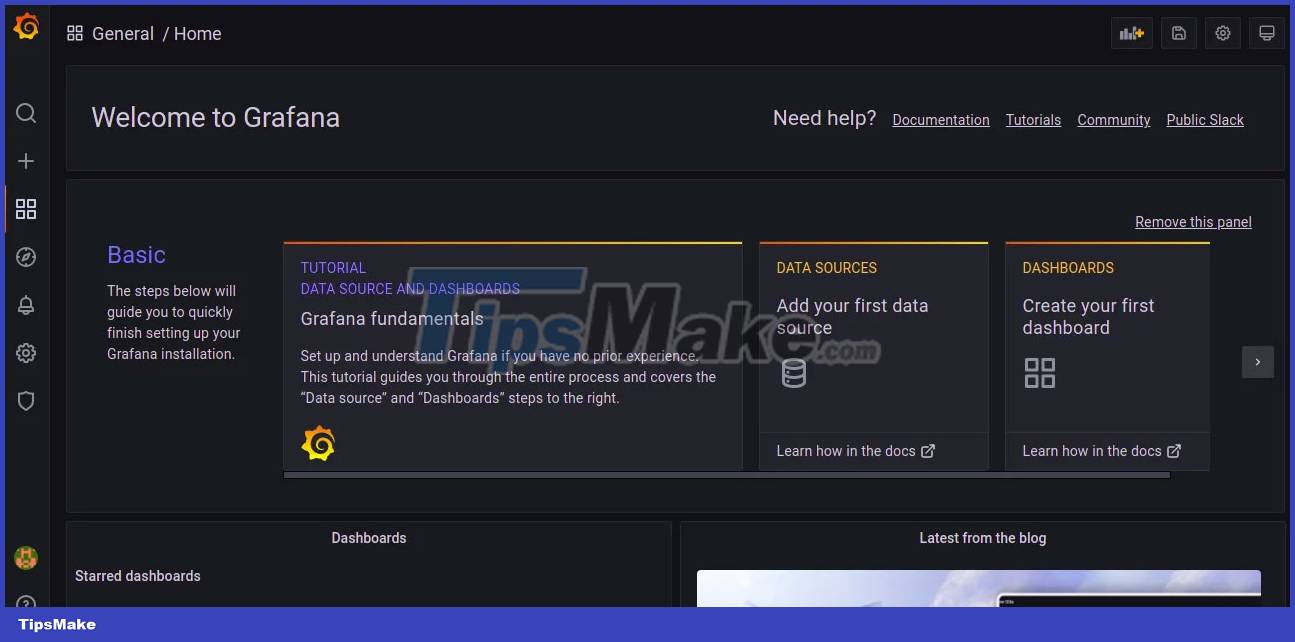
Enter the new admin password and click the Submit button . On the next page, you will see the Grafana dashboard:
Was this article helpful?
Your feedback helps us improve.
Related Articles
 How to Install and Use Grafana for Real-Time Data Visualization5 minutes read
 How to install and use Kali Linux on VmWare virtual machine9 minutes read
 How to install Solus Linux6 minutes read
 5 reasons to install Linux on old computers5 minutes read
 How to install Kali Linux on macOS10 minutes read
 How to install NVIDIA drivers on Kali Linux6 minutes read
Reader Comments 0
Sign in with email or Google to join the discussion.