Guide to graphing geometries using Geogebra software
Normally you usually graph the function by hand. It is very simple with Geogebra that helps you draw function graphs and export function graphs that have drawn many different formats so that you can conveniently insert textbooks and textbooks. Posts below Instructions
Normally you usually graph the function by hand. It is very simple with Geogebra that helps you draw function graphs and export function graphs that have drawn many different formats so that you can conveniently insert textbooks and textbooks. The following article is a detailed guide on how to draw graph geometry with Geogebra software.
If you do not have Geogebra installed, you can download the software here: https://www.geogebra.org/download
After successful software installation, follow these steps to graph the function:
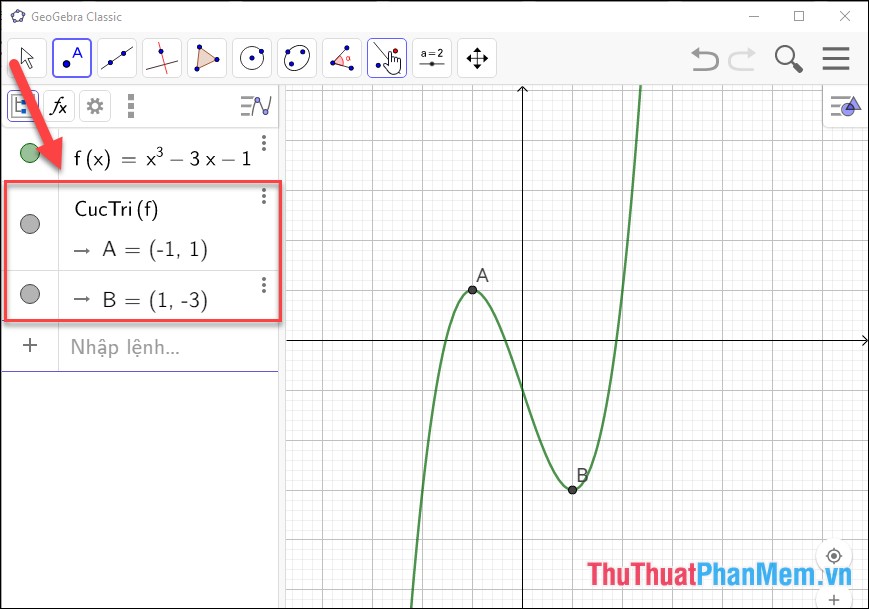
Step 1: In the input drawer, enter the expression for the function to draw. For example, here graph the third order function. Immediately the workspace has plotted the value of the function just entered:

Step 2: Determine the extreme point of the function graph:
At the command input prompt, type command CucTri (f) -> the system will automatically enter the names of 2 points on the graph with the same coordinates:
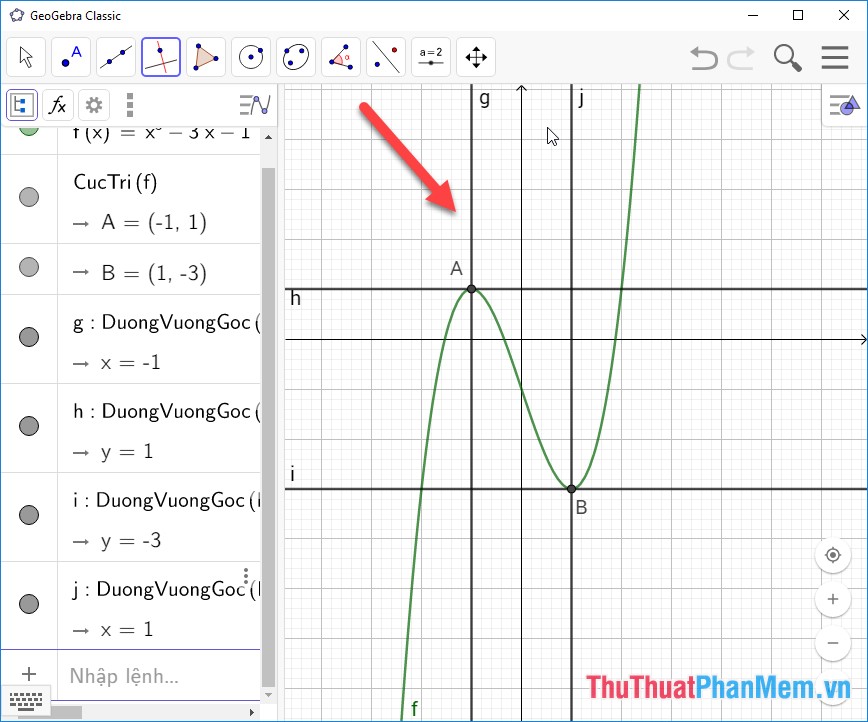
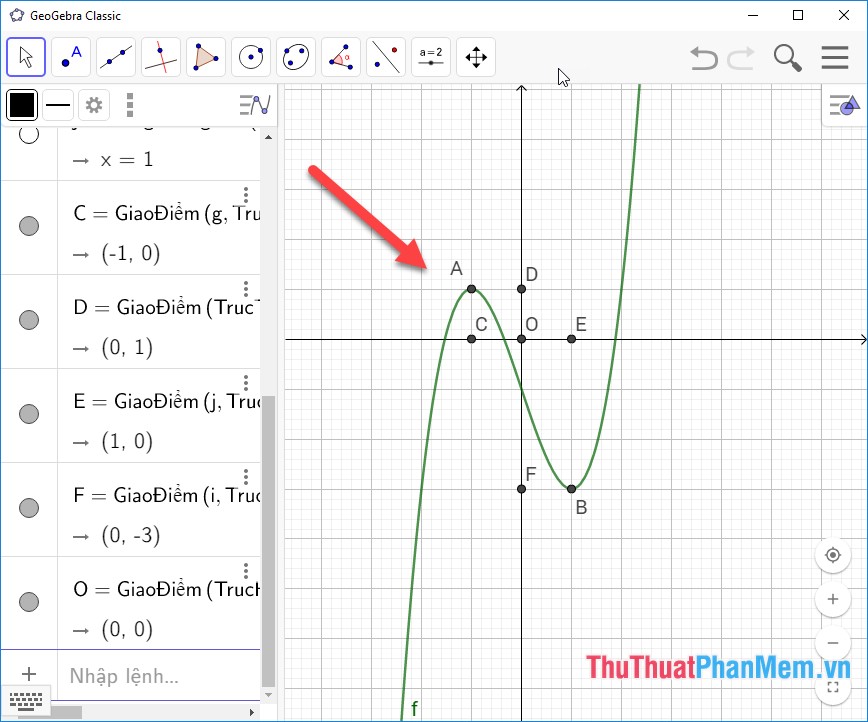
Step 3: Determine the intersection point of the extreme points with the coordinate axes:
Click to select the symbol of 2 intersecting lines -> select Perpendicular line:

Step 4: Select the points and lines that need to be drawn perpendicular to the extremities, for example, select point A and the vertical axis to create a line passing through A and perpendicular to the vertical axis -> similar to the lines Other perpendicular results:
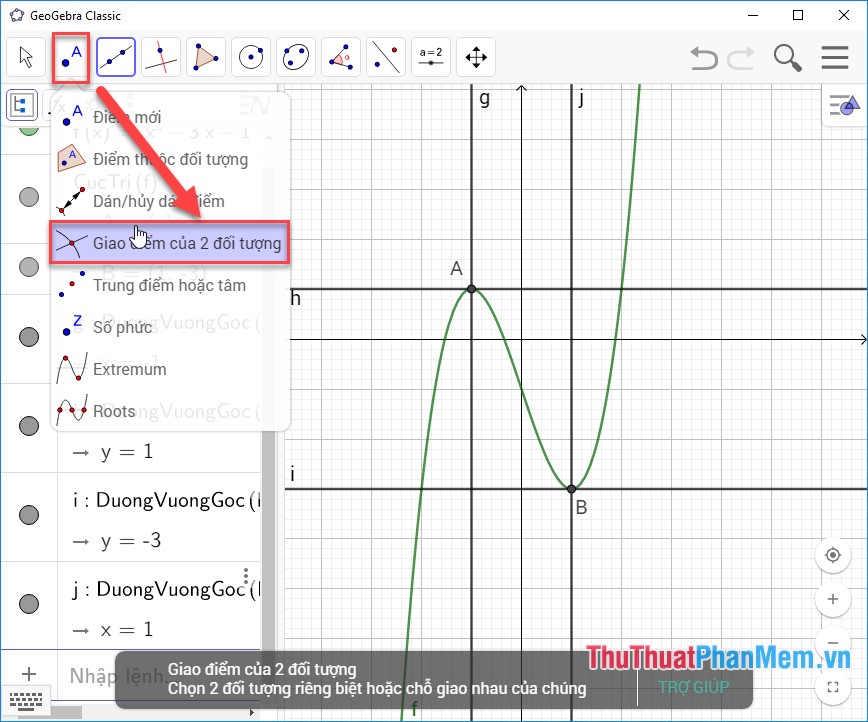
Step 5: Get the intersection of the lines perpendicular to the axes:
Click the icon of point A -> select Intersection of 2 objects:
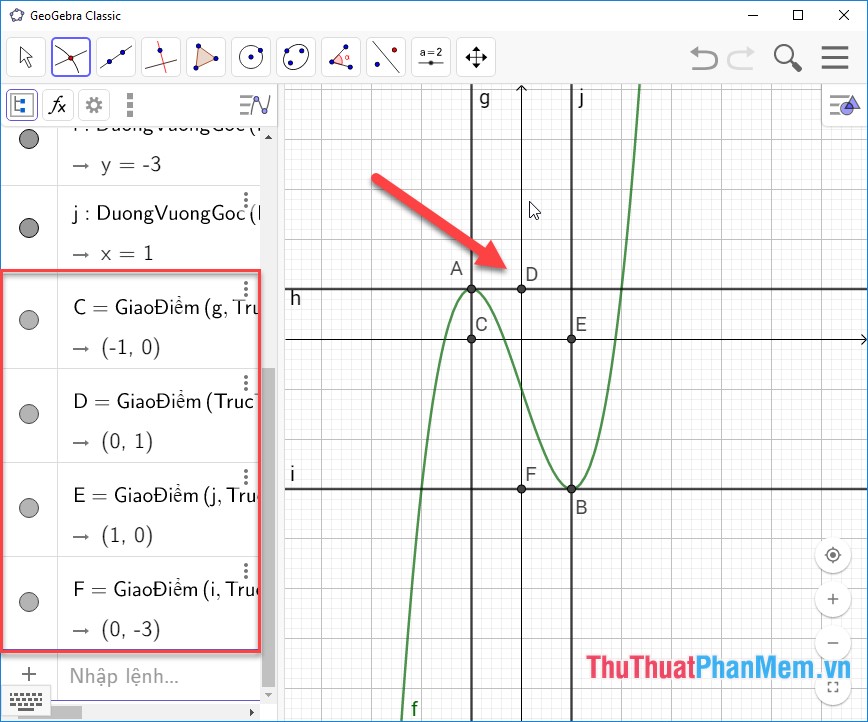
Step 6: Select two objects that need to determine the intersection point, the two objects here are the perpendicular lines passing the extreme point and the coordinate axes -> the results have determined the intersection points:
Step 7: Select the perpendicular lines -> right click and select Show objects to hide perpendicular lines:

The results created the graph and the intersection of the graph:
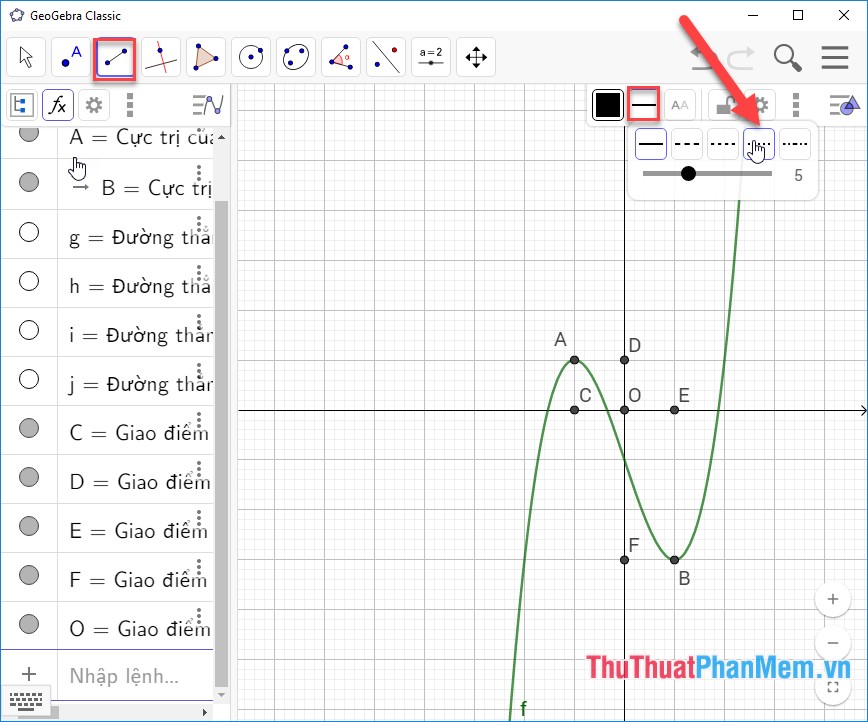
Step 8: Create dotted lines from the extreme to the intersections to determine the extreme coordinates:
Click the line icon -> select Line segment:

Step 9: Move to the right of the interface to select the type of the line you want to draw, here select the dashed line: (if no line style appears, click the icon

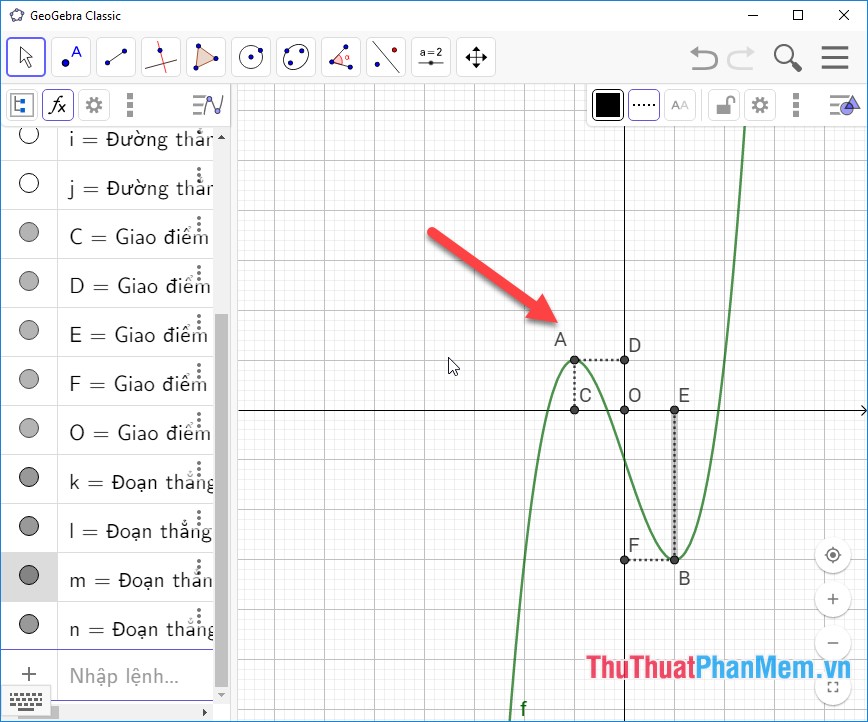
Step 10: Select 2 points to create a segment, for example, to determine the pitch of point A, choose point A and point D, similar to the rest points -> get the result:
Step 11: Determine the inflection point of the function graph:
At the command prompt, type keyword -> there appears a command to define inflection point:
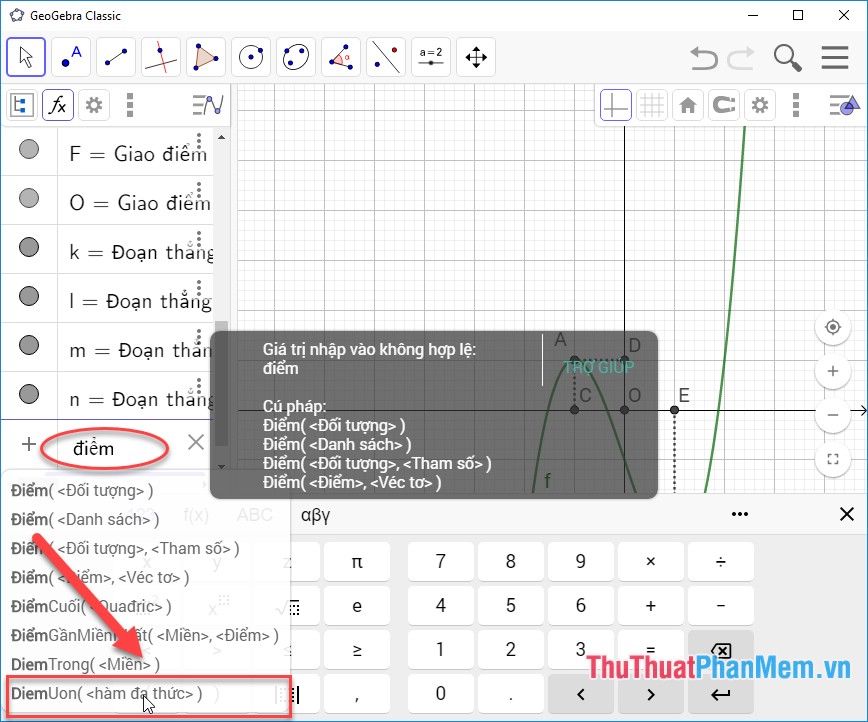
The system results show the coordinates and the inflection point name on the graph:
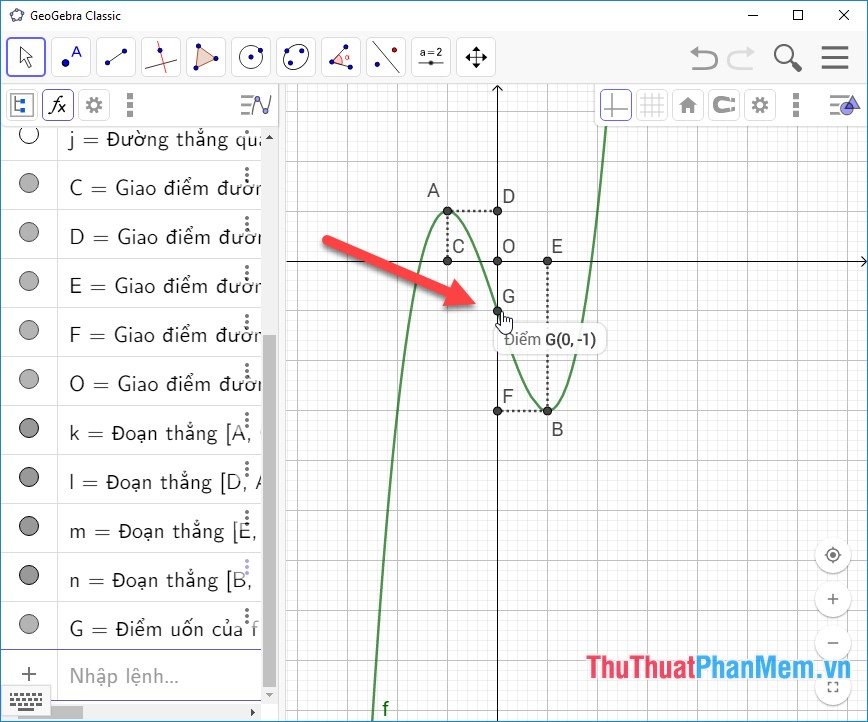
When graphing the function, you need to define at least 5 points, but the function graph has 2 points on the horizontal axis, so you don't need to define new points.
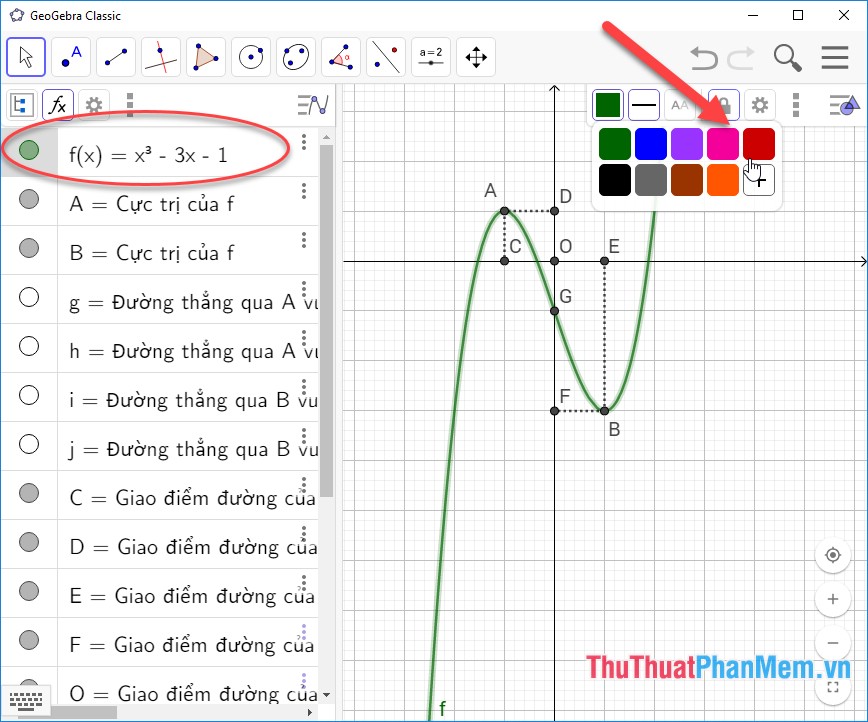
Step 12: Edit the function graph before exporting to another format:
Click on the function graph expression in the command input pane -> change the font size….
Step 13: Display the values on the axis-> right-click and select Working Area -> In the Horizontal axis tab , the Vertical Axis select Show numbers:
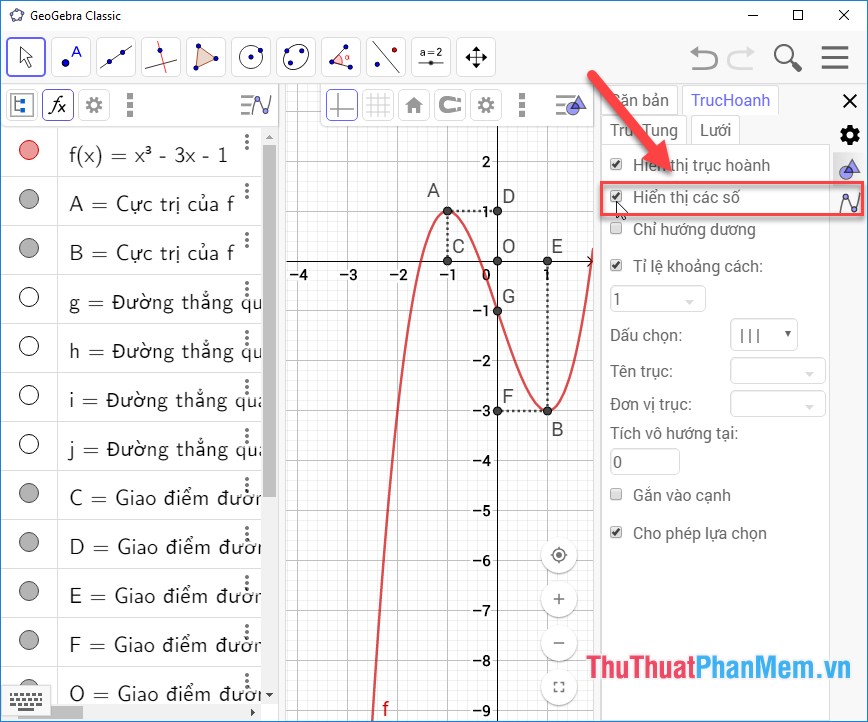
The results have been plotted on the function of the order of 3:
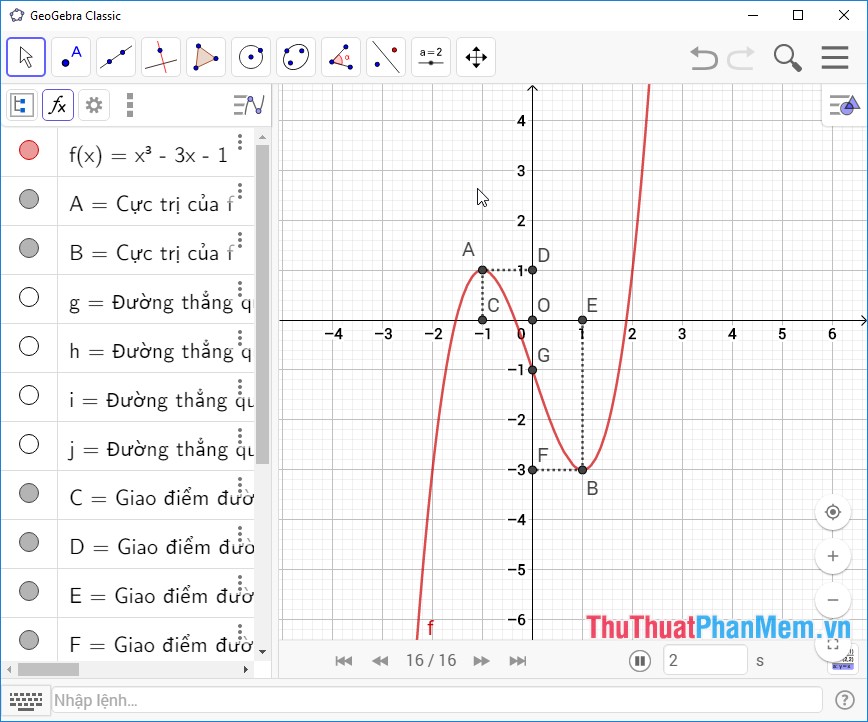
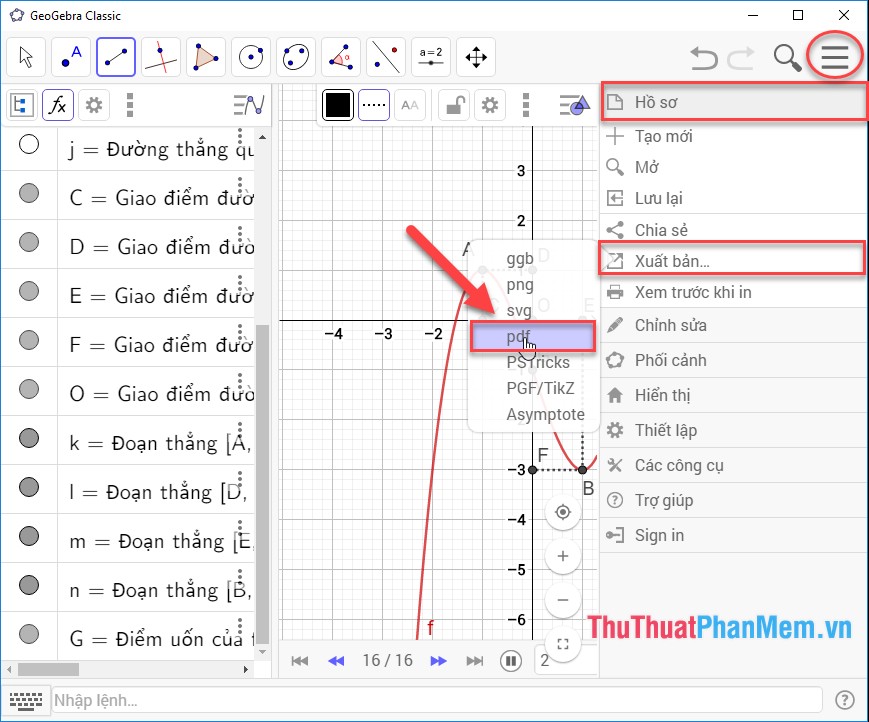
Step 14: Publish the drawn graph to another format:
Click the arrow icon -> redefine the function graph position -> go to the settings icon -> Profile -> Publish -> select the format to export, for example here choose format PDF file:
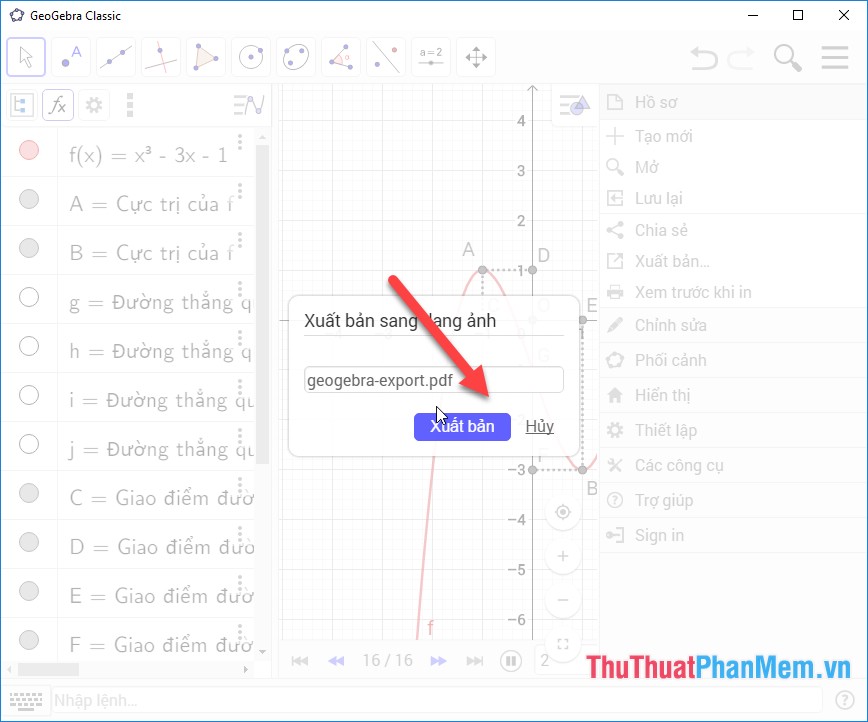
Step 15: A dialog box appears, enter a name for the export file or you can leave the system default name -> click Publish:
So you've drawn the function graph of the third order with other function graphs you do the same. Also with Geogebra you can draw other objects in geometry. Above is a detailed guide on how to draw graph geometry with Geogebra software. Good luck!
Was this article helpful?
Your feedback helps us improve.
Related Articles
 Instructions for using GeoGebra basic10 minutes read
 Functional graphing application5 minutes read
 Instructions for drawing graph functions online3 minutes read
 Top 5 best online graphing websites4 minutes read
 The best functional graphing software3 minutes read
 Top 7 function graphing software on computers5 minutes read
Reader Comments 0
Sign in with email or Google to join the discussion.