Invite to see malware with visual images with VirusTotal Graph
VirusTotal has just released a new feature - Graph - which allows users to visualize data from available files..
VirusTotal has just released a new feature - Graph - which allows users to visualize data from available files. With this tool, information such as which file to connect to which host, which file will be created . will be displayed in a visual image. Anyone can use Graph without buying a Premium version.
VirusTotal hopes this tool will help users better understand the relationship between the original file-related data types. This is a visualization tool based on the data that VirusTotal has. It understands the relationship between files, URLs, domain names, and IP addresses and provides an easy-to-navigate interface.
Discover, expand points on the chart, you can build networks and see relationships. Clicking on each point will show relevant information. You can also add detailed labels and reports using VirusTotal Public or VirusTotal Intelligence.
To use VirusTotal Graph, go to the URL below and provide the hash code or go to the analysis page for a specific file. On the analysis page, select under the dropdown to open VirusTotal Graph.https://www.virustotal.com/graph/

Open the Graph page after analyzing the file
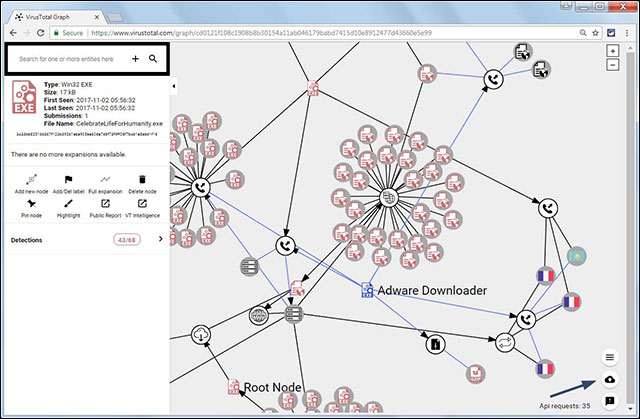
On the Graph page you will see Root Node (the item representing the file being analyzed), from here there will be many arrows pointing to the relevant information.
The Root Node example below has 2 URLs that connect to it.

Interface Graph with Root Node is the file being analyzed
You click on each point to open the details of that object. Below are the files downloaded from the Root Note when it connects to a URL.

The files are downloaded from Root Note
And yet, when you double click on the downloaded file, you will see information related to that file. In general, this tool will help analyze malicious files more closely, view all data, files, domains, related countries, URLs .
Label and save custom Graphs
In addition to using Graph for existing files, users can also create maps and save them. For example, after analyzing a malware sample, you want to add labels to objects, for example.
To add a label, right-click and select Add a Label. Like the image below, the Adware Downloader label is added. Then save it, the map will be attached with a link to access or share with others.
Add labels to objects
It may take time to get familiar with VIrusTotal, but thanks to the information it provides and how it is displayed, this is a useful tool for analyzing malware.
Below is a video tutorial of using this new VirusTotal tool.
See more:
- Set of 3 virus checking services right on the browser
- How to know for sure a safe file before downloading?
- Visualize programming for those who don't know the code