How to open the formula management window in Excel
Excel supports the formula management window used in the data table so that we can see the formula anywhere on the data table, instead of having to manually scroll up and down.
Table of Contents
This is the Watch Window tool in Excel, which has the ability to manage Excel formulas in 1 window, along with the displayed results for us to know immediately. Thus users will be more flexible in managing Excel data tables. The following article will guide you to use the Excel formula tracking window.
Instructions for using the formula window in Excel
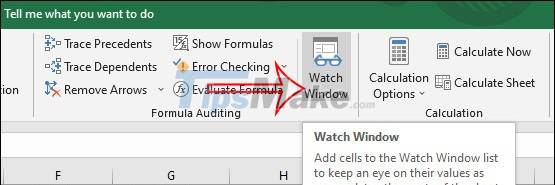
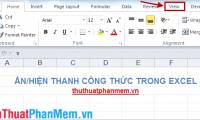
Step 1:
First highlight the entire data table. At the interface in Excel we click on the Formulas item in the Ribbon and then look down at the group below, click on Watch Window .
Step 2:
Display the window interface, we click the Add Watch button .
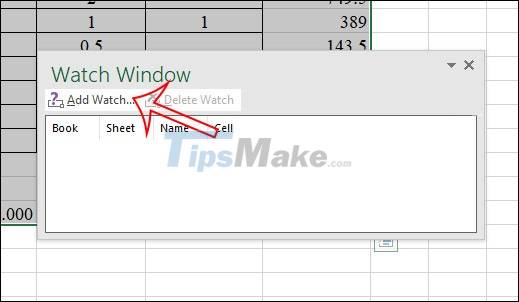
Immediately then display the data area that we highlighted earlier, click the Add button to agree.

Step 3:
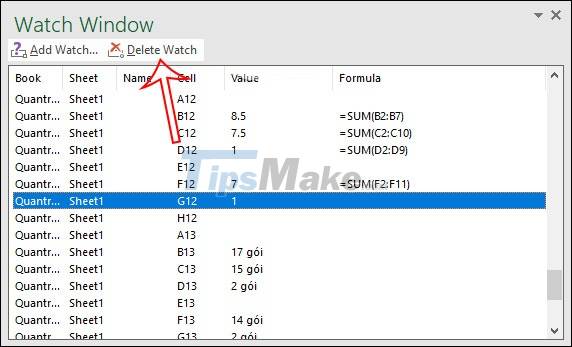
As a result, we will see all the data in the table put into the monitoring window as shown below. Each data is divided into different columns, depending on what type of data it is. Here you can view the formula through the Formula cell and the result of the formula right next to it.
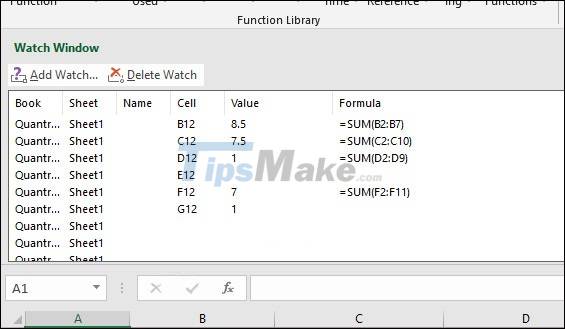
The interface of this window will continuously display on the data sheet. You can attach this management window to the formula bar by double-clicking the gray area in the management window.
To return to the minimized interface, move the window out of the formula bar.
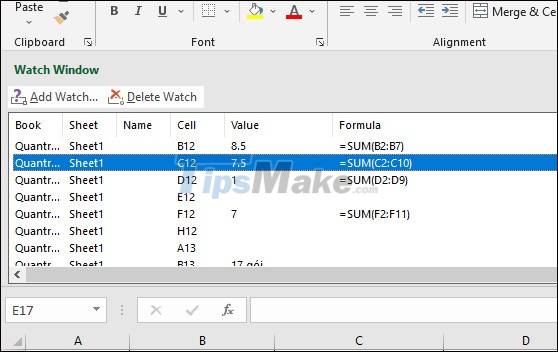
Step 4:
In this interface you can also delete data by clicking on it and pressing Delete Watch. To turn off the window interface, click Watch Window again or always click on the X icon and you're done.
Was this article helpful?
Your feedback helps us improve.
Related Articles
 Difference between function and formula in Excel5 minutes read
 5 useful Microsoft Excel formulas for calculating taxes10 minutes read
 MS Excel 2003 - Lesson 5: Excel formulas and functions6 minutes read
 How to use formula suggestions in Excel on the web5 minutes read
 How to enter formula data in Excel2 minutes read
 Hide / show the Formula Bar in Excel2 minutes read
Reader Comments 0
Sign in with email or Google to join the discussion.