Table of Contents
You can turn study notes into a chalkboard-style infographic with an AI tool that accepts documents and generates images. The most reliable workflow uses two stages: first ask the tool to extract and organize the facts, then generate a visual from the approved outline. This reduces overcrowding and makes errors easier to catch than asking for a finished poster in one long prompt.
Before uploading a document
- Remove names, grades, contact details, and other personal information.
- Do not upload confidential, copyrighted, or school-controlled material unless you have permission and understand the service's data settings.
- Use a short source focused on one topic. A full textbook chapter is usually too much for one readable graphic.
- Keep the original document open so every statement, date, formula, and example can be checked.
Step 1: Ask AI to create a factual outline
Upload the source document, then use a prompt like this:
Read the attached material and create a concise study outline for [audience or grade]. Use only information supported by the source. Organize it into: key idea, 3–5 essential points, one short worked example, common mistakes, and a five-item recap. Keep each item under 20 words. If information is unclear or missing, flag it instead of guessing. Do not create an image yet.
Review the result against the source. Correct omissions and remove details that will not help with quick revision. For mathematics and science, independently check symbols, signs, units, diagrams, and the order of operations.
Step 2: Generate the chalkboard design
Once the outline is accurate, paste the corrected version into this reusable image prompt:
Create a 16:9 educational infographic that looks like a clean classroom chalkboard.
Topic: [topic]
Audience: [grade or knowledge level]
Exact content to include:
[paste the approved outline]Layout: large title at the top; 3–5 clearly separated sections; short recap at the bottom; generous space around every block.
Visual style: dark green board, legible white chalk text, yellow and blue accents, simple hand-drawn icons, restrained decoration.
Requirements: reproduce the supplied wording exactly; do not add facts; keep formulas and symbols unchanged; use large readable text; avoid crowded boxes; no watermark or decorative text.
If the tool offers an aspect-ratio control, choose landscape 16:9. If it provides a separate image-generation button, select that after the prompt and source have been attached.
Subject-specific prompt additions
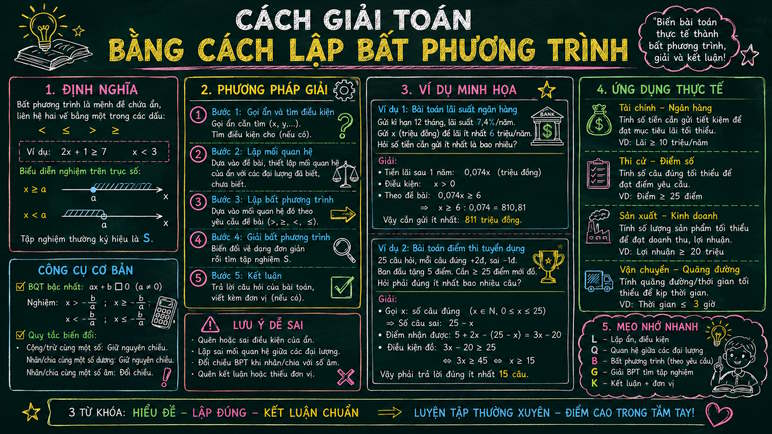
Mathematics
Add these instructions after the main prompt:
Show one fully checked worked example with each transformation on a separate line. Preserve mathematical notation exactly. Include a small “check your answer” box. Do not invent a graph or diagram that is absent from the approved outline.
Language study
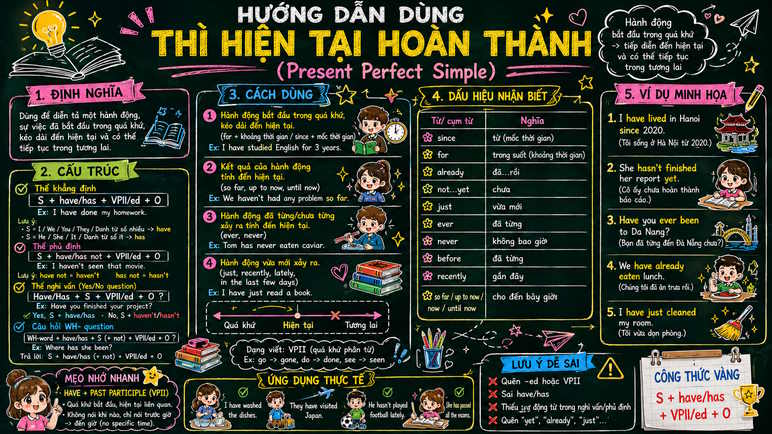
For grammar, vocabulary, or writing instruction, add:
Include the rule, sentence structure, two short examples, common errors, and a compact comparison box. Keep example sentences natural and appropriate for [audience]. Reproduce accented characters and punctuation exactly.
Literature and essay writing
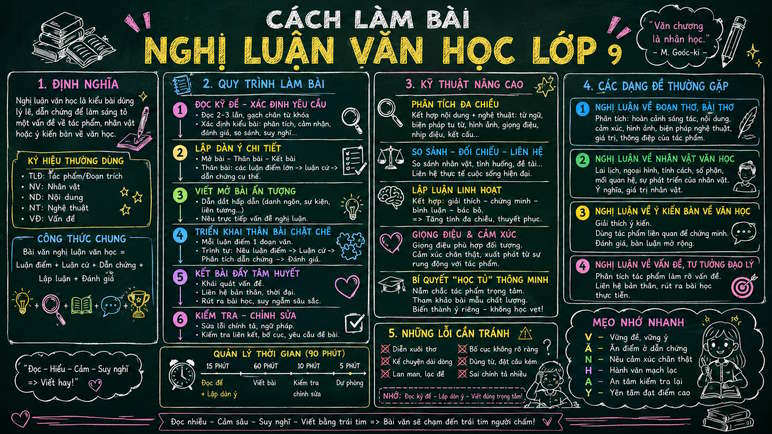
Ask for a framework rather than invented quotations:
Show the purpose of the essay, a suggested structure, questions to ask during analysis, evidence-handling tips, and common mistakes. Do not create quotations, page references, or claims about a text that are not in the approved outline.
Check the generated image before using it
Image generators often misspell text, alter numbers, or redraw formulas incorrectly even when the prompt says not to. Zoom in and compare every element with the approved outline.
- Check spelling, capitalization, punctuation, and accented characters.
- Verify formulas, dates, names, labels, and units character by character.
- Confirm that headings match the information beneath them.
- Remove any unsupported “tips,” examples, or decorative claims.
- Make sure the text remains readable on a phone and when projected or printed.
- Add alternative text or provide the same information as selectable text for accessibility.
If the poster is inaccurate or crowded
Do not ask the model to “fix everything” without identifying the problem. Regenerate one smaller section, shorten the approved outline, or request a layout with fewer columns. For content that must be exact, use AI only to create a background or rough layout and assemble the final text manually in a presentation or design application.
A good study graphic is not the one with the most boxes. It is the one that accurately communicates a small set of useful ideas at a glance.
Related Articles
 Who Created the 'Blue Screen of Death' on Windows?5 minutes read
 How to Convert Scanned Documents to Word Documents: Complete Guide5 minutes read
 How to Convert Word Documents to HTML Format: Clear Instructions7 minutes read
 How to Convert JPEG Images to Word Documents: Practical Guide3 minutes read
 How to Convert Word Files to PDF Format: Clear Instructions8 minutes read
 Simple Way to Convert Excel Files to PDF: Exel to PDF8 minutes read
Reader Comments 0
Sign in with email or Google to join the discussion.