Best Linux monitoring tool & software
Like Windows, the infrastructure that runs on Linux must also be monitored, which is why today TipsMake.com summarizes the best monitoring tools and software available today.
Although Windows is one of the most popular server operating systems, there are also a significant number of Linux users around the world.
Like Windows, the infrastructure that runs on Linux must also be monitored, which is why today TipsMake.com summarizes the best monitoring tools and software available today.
Here are some tools that may be helpful for monitoring Linux-based systems. Take a closer look at each of these tools and see what they provide for monitoring Linux systems!
Best Linux monitoring tools and software in 2019
- 1. Site24x7's monitoring platform
- 2. Solarwinds Netflow Traffic Analyzer
- 3. PRTG Network Monitor
- 4. Zabbix
- 5. Nagios Core
- 6. OpenNMS
1. Site24x7's monitoring platform
With Site24x7's monitoring platform, you can eliminate Linux server outages and performance issues by constantly tracking over 60 key performance metrics, including the load average, CPU, memory, disk space, network bandwidth utilization, recent events, and Linux processes.
Configure thresholds for key performance metrics and receive instant alerts via SMS, emails, mobile app push notifications, and other ITSM and collaboration tools whenever these thresholds are breached.

Site24x7 lets you automate incident remediation and makes your IT operations more agile and efficient.
Key features:
- Better visibility into the processes that affect your server health and performance with the exclusive Top Process Chart
- Services monitoring and syslog monitoring for Linux servers
- A single console for MSPs to monitor their customers' IT infrastructures
- Monitored metrics pushed via StatsD
- Support for over 100 plugins, including Redis, MySQL, and NGINX
2. Solarwinds Netflow Traffic Analyzer
Netflow Traffic Analyzer comes from SolarWinds, a company well known for creating leading monitoring tools.

Main features
Netflow Traffic Analyzer comes with a host of features, confirming its popularity and its widespread use. Key features include:
- Determine which users and applications are consuming the maximum bandwidth.
- Provides instant notification when usage exceeds bandwidth usage threshold.
- Lets create separate IP address groups to see traffic the way you want.
- Have a comprehensive view of the entire network traffic on a single dashboard.
- Detecting the underlying problem and learning its roots is quite easy, as you can create custom views of the available data.
- You can drag and drop network performance metrics along a common timeline to quickly identify problems.
- Provides the option to view the same data in multiple formats and views to get the right viewing angle.
- Make it possible to view network traffic segmented by the Class of Service method. This tool even allows you to measure the effectiveness of CBQoS policies.
- Help you set up customized views of your Internet traffic for ISPs to better understand how to balance between different service providers.
- Provides support for various vendors and technologies such as NBAR2, NetFlow v5, NetFlow v9, sFlow v2, v4, v5, IPFIX, U-Flow, Huawei, Cisco, Extreme Networks, HP, Juniper, Nortel, vSwitch and VMware.
- Flow navigation module helps create and access personalized network traffic.
- You can view in-depth network reports with just one click.
- Take advantage of existing Active Directory user accounts to manage simple and easy login.
- Integrates well with other products from SolarWinds such as Network Performance Monitor, User Device Tracker and Network Configuration Manager.
System requirements
You need the following basic system requirements for Netflow Traffic Analyzer:
- CPU - Quad core 3GHz and above
- Memory - 16GB for flow storage database and 3GB for main Poller
- Hard drive - 3GB for the main Poller and 20GB for the traffic storage database
- Operating system - Windows Server 2008 R2 SP1, 2012, 2012 R2 for both the traffic storage database and the main Poller.
- Database - Share SQL with Network Performance Monitor
3. PRTG Network Monitor
PRTG Network Monitor from Paessler is a stable, secure and efficient monitoring tool for Linux systems.
Main features
PRTG Network Monitor features include:
- Provides an overview as well as in-depth information about the status and performance of Linux devices.
- Provide information on all possibilities, help with better planning.
- Monitor a variety of devices such as NTP, hard drive and memory.
- You will receive instant notification of bandwidth overload and many other important features.
- Help easily identify critical weaknesses and imbalances in the Linux network.
- Has a convenient tracking system to always catch abnormal incidents and to analyze suspicious traffic.
- Provides a detailed view of data traffic structure on Linux network.
- Easy to install and quick to get started.
- Compatible with many mobile devices
- Control panels and custom applications give you data the way you want.
- Supports multiple languages such as English, German, Spanish, French, Dutch, Russian, Japanese, Portuguese and Simplified Chinese.
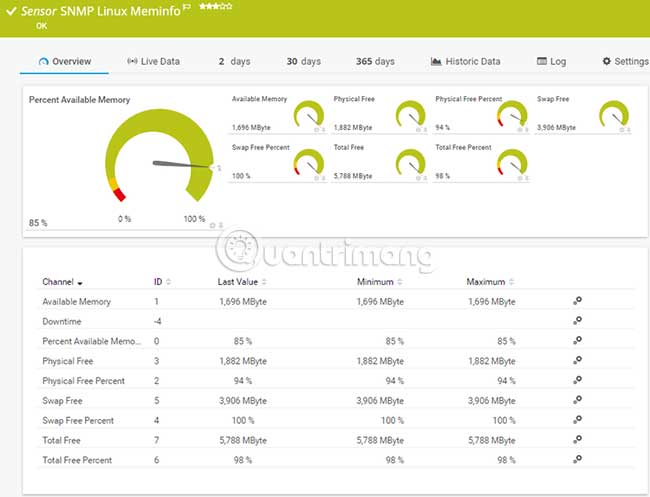
The sensor
The PRTG operates on a sensor-based system in which each sensor collects a specific type of data that can provide insights into one aspect of the network. Some common sensors used to track Linux are:
- Load Average - Monitor the system average load via SSH or SNMP.
- Meminfo sensor - RAM tracking available
- Diskless sensor - Check the amount of hard disk space available for Linux
- SNMP flow sensor - Use SNMP to monitor the flow of equipment.
- WBEM Custom - Perform custom queries through WBEM
Price
Pricing depends on the number of sensors you want to license. Break down the cost for each option as follows.
- 100 sensors - Free of charge
- 500 sensors - $ 1,600
- 1000 sensors - $ 2,850
- 2500 sensors - $ 5,950
- 5000 sensors - $ 10,500
There are also two packages provided by PRTG that support unlimited sensor settings. The first package, called XL1 Unlimited, allows you to install any number of sensors on a main installation and it costs $ 14,500.
Another package called XL5 allows unlimited installation of sensors on five core installations and costs $ 60,000.
The above costs include one year of maintenance. To renew, you will need to pay 25% of the value of the original license.
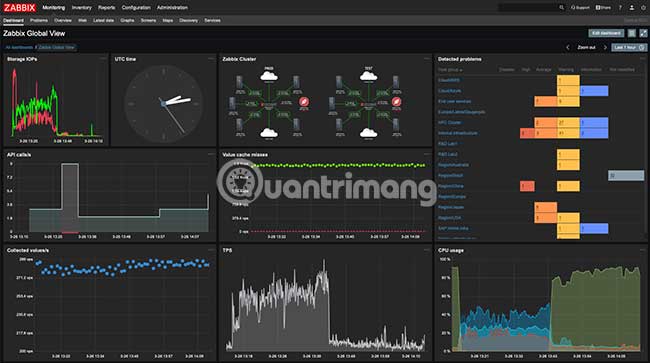
4. Zabbix
Zabbix is an expandable platform designed to track real-time data, collected from various devices in the network.
main feature
Zabbix's features are:
- Detect problems when data comes from many different devices. This means there is no need for a separate module to check for problems.
- Provides flexibility to specify the options you want.
- You can also set the severity level.
- Help analyze root cause and detect abnormalities
- Predict usage based on past trends and this can help with planning capabilities.
- Comes with a native web interface, providing an overview of the IT environment.
- Graphs, network maps and slideshows greatly enhance the visual appeal of the data.
- The report can be analyzed to the smallest detail and can be in the form you want.
- Help to adhere to various industry standards.
- Send messages and announcements by multiple channels.
- Zabbix tries to fix problems automatically as they happen based on past trends.
- You can define service level for notifications
- Message can be customized.
- Strong encryption is present among all Zabbix modules, for an extra layer of security.
- Supports multiple authentication methods such as Open LDAP and Active Directory.
- Open code for security testing.
- Installation in minutes and very easy to use.
- Configuration templates help monitor thousands of devices from many different vendors.
- There are creative templates for popular platforms. Or not, you can also build a custom template.
- Scan the network periodically to identify devices and add them to the network map.
- Automatically create trigger elements and graphs.
- Monitor devices, even behind firewalls and DMZ.
- Collect data even in case of network failure or problem
- Allows you to run custom scripts remotely from monitored devices.
- Zabbix can be managed via API
- Integrates well with many third party tools
- Supports multiple operating systems such as Linux, Solaris, BSD, IBM AIX, IBM Power8, HP-UX and MacOS.
Price : 100% free.
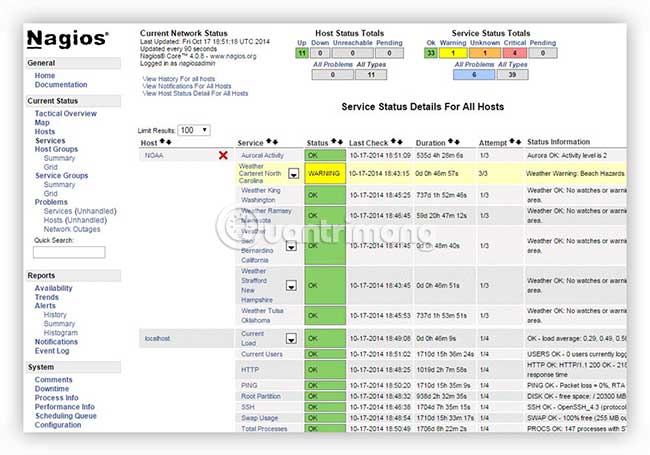
5. Nagios Core
Nagios Core is a warning and monitoring tool on which hundreds of Nagios applications are built. This warning and scheduling platform is written in C language for performance reasons and is designed to run on Linux / Unix systems.
main feature
Nagios features include the following.
- Monitor network services such as SMTP, POP3, HTTP, NNTP, PING, etc.
- Different metrics of server resources such as processor and disk are also monitored by this tool.
- Comes with a simple plug-in design that allows you to develop your own service testing methods.
- You can define network host hierarchy by using the parent host.
- Detect problem hosts and distinguish them from 'healthy' hosts.
- Support the implementation of preventive supervision tasks.
- Comes with web interface for viewing the status, performance, and health of various devices.
- Provide a web-based configuration.
- Dashboard (Dashboard) can be customized to meet your preferences.
- Advanced reporting features help create stunning visual reports.
- Powerful API scripting that allows monitoring of remote and local systems and devices.
- Provides a centralized view for the entire IT monitoring infrastructure.
- Help planning capabilities.
- Provides scheduled downtime warnings during the upgrade process.
- Provides multiple users access to the web dashboard.
- Event Listener allows automatic restart of faulty services or applications.
- Many add-ons have been developed by the development community to expand Nagios Core's functionality.
- Open source and provide full access to the source code.
System requirements
- To run Nagios Core, you need the following:
- A system running Linux or Unix. Network access and C compiler should be available.
- A web server, preferably Apache
- Thomas Boutell's gd library version 1.6.3 and above
Pricing : Open source and therefore free to use.
6. OpenNMS
OpenNMS is an open source network management platform designed to build network monitoring solutions.
main feature
The following is an overview of the features of OpenNMS:
- It is built on an event-driven architecture.
- Service detection stopped working immediately.
- Measure latency and notify when threshold limit is exceeded.
- Provides outstanding support for many services with configuration options.
- Remote monitoring of applications and services.
- Collect performance metrics from industry standards such as SNMP, WMI and XMP.
- Collect performance data from applications using custom collectibles such as HTTP and JSON.
- This tool can be extended to any performance data collection framework.
- RestAPI makes it easy to integrate OpenNMS into your existing infrastructure.
- Explore layer 2 network topology.
- Comes with an interactive service map for easy digging right into the problem.
- Geographic node maps show the nodes and services that have stopped working in different geographical areas with Google Maps or Open Street Map.
- Visualization of Grafana-based performance data enhances the visual appeal of information.
Price
OpenNMS has two versions - Meridian and Horizon. While Horizon is free, Meridian comes with an annual subscription.
To decide which of these two options is right for you, here's a quick look at the key features of both versions.
Main features Meridian Horizon For whom ? Enterprise seeking stable platform with long-term support. Enterprises want to monitor new technologies and IT ecosystem. Open source development model Open source License type AGPL v3 or proprietary license AGPL v3 Release cycle every 12 months Support every 3 to 4 months Support Comes with organization support, along with access to OpenNMS connection forums. Wiki and mailing lists (community based email lists). Configurable events Pre-configured events, notifications, data collection, workflows, and reporting. Community-based configuration of Access Maintenance to update the code for the latest bugs and bug fixes. Rely on the community
Above is a list of the best Linux monitoring tools and software for you to get started. There is a free and paid version of almost every tool. In addition, many tools also provide you with a 30-day trial, allowing them to be installed and configured quickly, providing tracking capabilities after only a few hours.
Hopefully these monitoring tools will help you monitor your Linux environment. If the article misses any tools, feel free to contribute in the comment section below!
Wish you find yourself the right tool!
- Best SNMP monitoring software
- 10 best Ping monitoring software and tools
- 6 leading Exchange Server monitoring software
- 5 useful network monitoring tools
- 11 best MySQL monitoring tools for adjusting and managing SQL Server performance
- How to monitor Nvidia GPU performance on Linux
- Top 5 best computer monitoring and monitoring software 2020
- How to know if someone has installed surveillance software on your laptop?
- 4 methods to copy Linux hard drive
- Kali Linux 2022.3: Comes with white hat hacker tool upgrades
- The simplest way to speed up Linux startup: Disable unnecessary services.
- How to know if someone has installed surveillance software on your laptop?
- The best employee computer monitoring software
- Instructions for converting vieo file into Xvid / x264 format with Avidemux
- Convert audio formats in Linux with Gnac
- 10 indispensable Office applications of Linux
- GIMP or Photoshop is the right tool for you?
- Delete cookies in popular browsers
- How to sync Microsoft OneDrive with Linux
- Watch YouTube videos on Linux Mint 11 with Minitube
-
 How to troubleshoot Wi-Fi issues on Windows 11
-
Causes and solutions for laptops unable to connect to Wi-Fi on Windows 11.
-
Easy ways to boost your phone signal
-
A simple and stable way to connect two computers together.
-
A simple guide to setting a static IP address on a MacBook.
-
Charge USB-powered devices via a network cable; instructions for powering devices without a USB port.
 How to troubleshoot Wi-Fi issues on Windows 11
 Causes and solutions for laptops unable to connect to Wi-Fi on Windows 11.
 Easy ways to boost your phone signal
 A simple and stable way to connect two computers together.
 A simple guide to setting a static IP address on a MacBook.
 Charge USB-powered devices via a network cable; instructions for powering devices without a USB port.