Instructions for creating and editing reports in SQL Server Reporting Services
SQL Server 2005, 2008 and 2008 R2 product suite, all packaged with SQL Server Reporting Services (SSRS) - a dedicated solution for creating reports for businesses. With SSRS, users can create, schedule, post and manage various reports from various sources of original data.
QuanTriMang.com - The set of SQL Server 2005, 2008 and 2008 R2 products, all packaged with SQL Server Reporting Services (SSRS) - a specialized solution for creating reports for businesses. With SSRS, users can create, schedule, post and manage various reports from various sources of original data. In the later part of this article, we'll create, edit, and export SSRS reports manually.
Assign SSRS Report to Project in BIDS:
First, you need to consult and complete the initial steps of SSRS here. To create a report in the normal way in Business Intelligence Development Studio (BIDS), you should follow the following order:
Open BIDS, and select File> Open> Project / Solution.
Directions to Report Server Project created earlier.
In the Solution Explorer window, right-click on Reports and select Add> New Item .
Select Report in the Add New Item section , name the report (eg MyReport.rdl ) and click OK .
Here, you will have an empty, open SSRS report in BIDS :

In the left window, you will see the Toolbox and Report Data tags. If these tags are not displayed, select the appropriate tags from the View menu. The Toolbar tool displays all components on the report such as textbox and table, Report Data function will display data sources, including retrieval results from the root, including image files, data fields (wallet For example, the Page Number parameter.
Add Data Source and Dataset to Project:
The data source concept - the data source, here is the task of identifying the database (or other data objects, such as XML files) from the location you use to push data, the properties of Connection protocol - server name and account, used. This tutorial is based on the previously created SQL Server data source, please follow the following sequence:
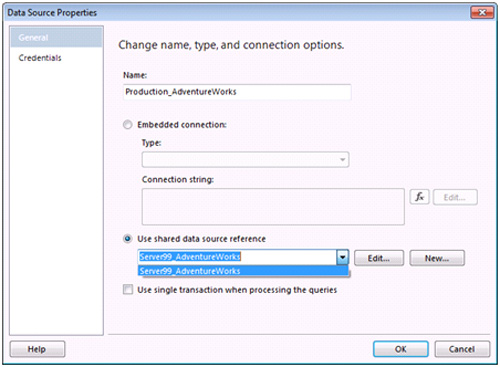
In the Report Data tab, select New> Data Source and name the original data.
Select Use shared data source reference
Select the source of the SQL Server database created earlier from the menu, click OK :
The concept of the dataset here is a set of data requirements, through query statements, or storage process, all of which start from the data source, in addition, the dataset also specifies the data Whichever is suitable to display on the report. To add dataset to the reports, follow these steps:
In the Report Data tab, select New> Dataset and name this component.
Select the database source at the step above.
Here, you type / paste the sample commands, or simply use the Query Designer feature . Examples are as follows:
SELECT P.Name,
ProductNumber,
Color,
ListPrice,
SC.Name [Category]
FROM Production.Product P
LEFT OUTER JOIN Production.ProductSubCategory SC
ON P.ProductSubCategoryID = SC.ProductSubCategoryID
WHERE ListPrice BETWEEN 0 AND 1000
ORDER BY Category, ListPrice ASC
Then click OK. At the end you will see the data set displayed in the data fields in the Report Data tab .
Add other components to the report:
After you have successfully initialized the dataset, you start creating the report. The first is the simple and familiar attributes such as the product table, title and page number.
Drag and drop the Table from the Toolbox tab into the main interface of the report.
In the Report Data tab, continue to drag and drop the Category, Color, Product, Name, and List Price data fields as follows:
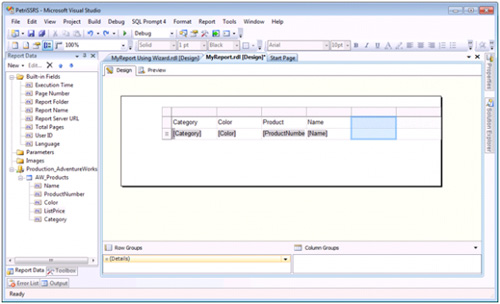
Do the same with the Textbox component, type AdventureWorks Products.
At the blank part of the report, right-click and select Insert> Page Footer.
Drag and drop the textbox into this footer, in Built-In Fields section on the Report Data tab, drag the tab to the Page Number element .
Use the Preview feature to preview the report table with standard input data.
Report format and export:
This is the last step to complete the reports, including features at the Design tab:
Add and delete columns: right-click the table and select Insert Column> Left or Right .
Change the width of the data column : drag and change the external part.
Change the font and format : select the corresponding data fields, customize or change according to user needs.
Standard digit display format: right-click the numeric data field, select Text Box Properties and change the Number section.
Resize the report : hover and drag at the corners to enlarge or shrink the size.
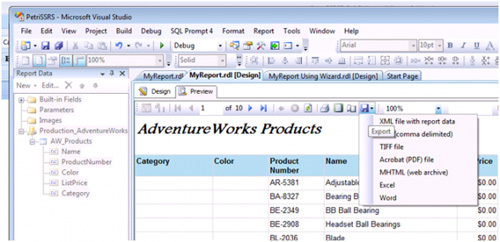
To export the report to different formats such as PDF, Excel . you do the following:
Select the Preview tab
Click the Export button above:
Then select the appropriate format, the path to save the file and click Save .
Above are the basic steps for creating and editing reports in SQL Server Reporting Services , but you can also refer to the example here: SQL Server Books Online, SQL Server Books Online Tutorials, Microsoft Press - Stacia Misner and CodePlex. Good luck!
Was this article helpful?
Your feedback helps us improve.
Related Articles
 Introduction to SQL Server Reporting Services6 minutes read
 Reporting service in MS SQL Server2 minutes read
 How to start and stop services in MS SQL Server3 minutes read
 HOW TO INSTALL ISA SERVER ENTERPRISE 200026 minutes read
 Create reports in Access 2016 and use advanced reporting options8 minutes read
 HOW TO INSTALL ISA SERVER ENTERPRISE 2000 - Part II15 minutes read
Reader Comments 0
Sign in with email or Google to join the discussion.