How to use the vmstat command on Linux
Suppose your Linux or macOS computer is using virtual memory. Discover how it affects the system's physical memory usage, CPU and resource usage.
Table of Contents
Suppose your Linux or macOS computer is using virtual memory. Discover how it affects the system's physical memory usage, CPU and resource usage.
What is virtual memory?
The computer is equipped with a finite amount of physical memory, called Random Access Memory (RAM). This RAM needs to be managed by the kernel, shared between the operating system and any running applications. If these combined needs require more memory than the physical installation in the computer, what can the kernel do?
Linux and Unix-like operating systems like macOS can use the space on the hard drive to help them manage memory needs. A dedicated area for hard drive space called 'swap space', can be used as an extension of RAM. This is virtual memory.
The Linux kernel can write the contents of a memory block into this swap space and release that RAM to use for another process. Memory can be removed from the swap space and restored to RAM when necessary called paged out.
Of course, access speed for paged out memory is slower than memory stored in RAM. And that is not the only tradeoff. While virtual memory provides Linux with a way to manage memory needs, the use of virtual memory will increase the burden on other parts of the computer.
Your hard drive must read and write more. The kernel and CPU must do more when swap in (move data from swap space to main memory) and swap out (move main memory contents to disk swap, when space is available). main memory is full) memory, as well as keeping all disks spinning to meet the memory needs of many different processes.
Linux provides a way for you to monitor all of these activities as vmstat commands, reporting virtual memory statistics.
Vmstat command
If you type the vmstat command without parameters, it will show you a set of values. These values are the average for each statistic, since the computer was last restarted. These figures are not current values.
vmstat

A short value table is displayed.
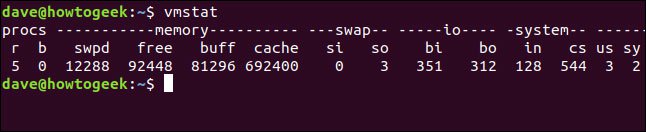
There are Procs, Memory, Swap, IO, System and CPU columns. The last column (rightmost column) contains CPU-related data.
Below is a list of data items in each column.
Procs
- r: Number of processes that can be run. These are processes that are already running or waiting for a new CPU cycle.
- b: Number of processes in continuous sleep state. In fact, these processes are not 'sleeping', but they are only blocking system calls (when the program calls a function or service that is in the kernel of the operating system) and cannot be interrupted until it executes. The current dynamic is completed. Typically, these processes occur when the device driver is waiting for some 'free' resources. Any disruption to these processes while in the queue is processed when the process continues to operate as usual.
Memory
- swpd: Virtual memory capacity used. In other words, this is the amount of memory that has been swapped.
- free: Idle memory capacity (currently not in use).
- buff: The amount of memory used as a buffer.
- cache: The amount of memory used to cache.
Swap
- si: The amount of virtual memory is swapped in from the swap space.
- so: The amount of virtual memory is swapped out into the swap space.
IO
- Ball: Blocks received from a block device. The number of data blocks used to exchange virtual memory back to RAM.
- bo: Blocks sent to a block device. The number of data blocks used to exchange virtual memory out of RAM and into swap space.
System
- Print: The number of interruptions per second, including the clock.
- cs: Number of context switches per second. The switch context is when the kernel changes from processing system mode to user mode processing.
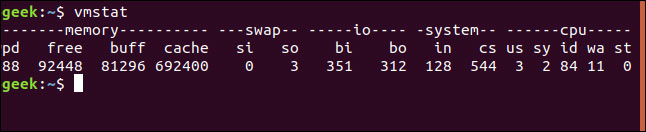
CPU
These values are all percentage of total CPU time.
- us: Time to run code is not kernel.
- sy: Runtime of kernel code.
- id: Idle time.
- wa: Time to wait for input or output.
- st: Time obtained from a virtual machine. This is the time a virtual machine must wait for the hypervisor to complete serving other virtual machines before it can go back and process the virtual machine.
Use a period of time
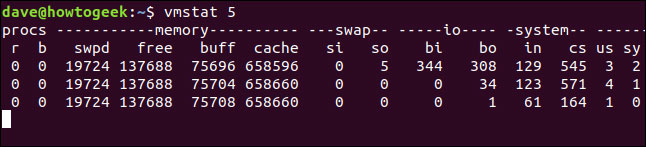
You can ask vmstat to provide regular updates for these metrics by using the delay value . The delay value is provided in seconds. To update statistics every 5 seconds, use the following command:
vmstat 5

Every 5 seconds vmstat will add another row of data to the table. You need to press Ctrl + C to stop this.
Use the count value
Using a delay value too low will put more pressure on the system. If you need to have quick updates to try to diagnose the problem, you should use the count value as well as the delay value .
The count value for vmstat indicates how many updates it needs to perform before exiting and returning you to the Command Prompt. If you do not provide the count value , vmstat will run until it is stopped by the Ctrl + C key combination.
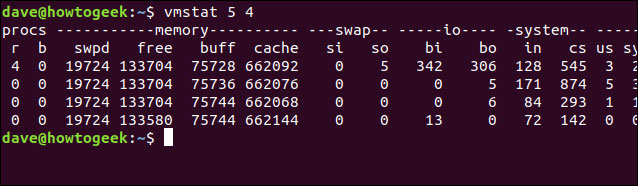
Let vmstat provide an update every 5 seconds, but in just 4 updates, use the following command:
vmstat 5 4

After 4 updates, vmstat will stop.
Change units
You can choose to display memory statistics and swap in kilobytes or megabytes using the -S (unit character) option. This option must be followed by one of the units k, K, m or M. They represent:
- k: 1000 bytes
- K: 1024 bytes
- m: 1000000 bytes
- M: 1048576 bytes
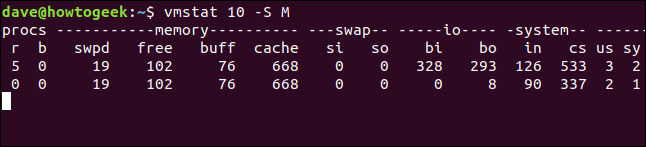
To update memory statistics and swaps every 10 seconds, displayed in megabytes, use the following command:
vmstat 10 -SM

Memory and swap statistics are currently displayed in megabytes. Note that the -S option does not affect IO block statistics . They are always displayed in blocks.
Memory is active and inactive
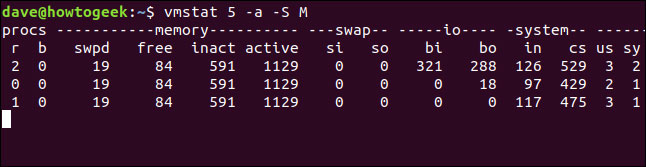
If you use the -a (active) option, the cache and cache columns are replaced with 'inact' and 'active' columns . As you might have guessed, these columns show the amount of memory inactive and inactive.
To see these two columns instead of buff and cache columns , include the -a option , as shown:
vmstat 5 -a -SM

'Inact' and 'active' columns are affected by the -S (unit character) option.
Fork
Switch -f displays the number of fork that has occurred since the computer was started. (Fork is an activity where a process creates a copy of itself).
In other words, this indicates the number of tasks that were started (and most of them closed) since the system was started. Each process started from the command line will increase this number. Every time a task or process generates or duplicates a new task, this number will increase.
vmstat -f
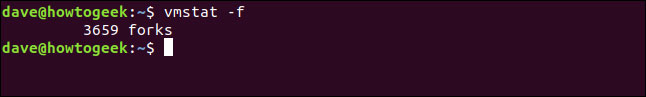
The display of fork does not update.
Slabinfo display
Kernel has its own memory management feature to manage the operating system and all applications.
As you can imagine, the kernel is allocating and releasing memory multiple times for many different types of data objects it must handle. To make this as effective as possible, it uses a system called slab. This is a form of cache record.
Memory is allocated, used and no longer needed for a specific type of kernel data object, which can be reused for another data object of the same type without the need for memory to be released and allocated. again. Imagine that the slab has been pre-allocated and measures the RAM segments for the kernel's specific needs.
To see statistics for slab, use the -m (slab) option. You need to use sudo and will be prompted to enter a password. Since the output can be quite long, you should use the less option .
sudo vmstat -m | less

The output has 5 columns, including:
- Cache: The name of the cache.
- num: Number of objects currently active in this cache.
- total: The total number of objects available in this cache.
- size: Size of each object in the cache.
- pages: The total number of memory pages that have (at least) an object currently associated with this cache.
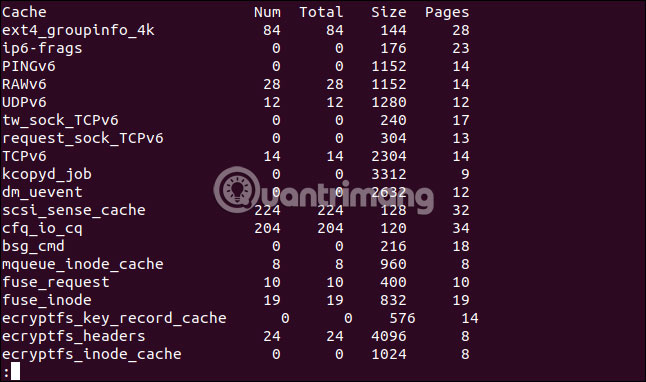
To exit less mode , press q .
Displays event counters and memory statistics
To display a page of event counters and memory statistics, use the -s (stats) option. Note that, the letter s is lower
vmstat -s

Although the statistics are reported in much the same way as the information generated by the default vmstat command, some of the data is divided in more detail.
For example, the default output combines both nice and non-nice user CPU time into the us column. The -s (stats) option lists these statistics separately.

Show drive statistics
You can get a similar drive statistics list using the -d (disk) option.
vmstat -d | less

For each drive, there are 3 columns displayed, which are Reads, Writes and IO.
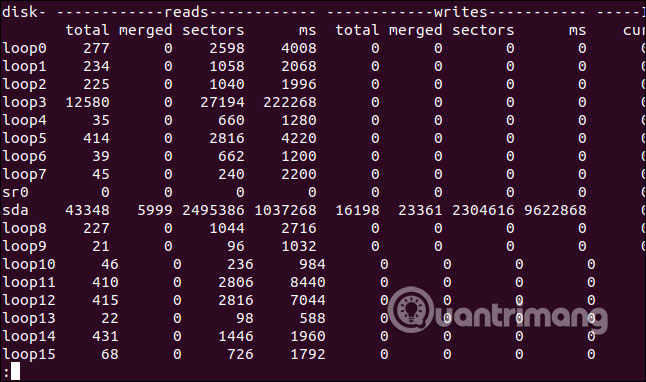
IO is the rightmost column. Note that the sec column in IO is measured in seconds but time-based statistics in Reads and Writes columns are measured in milliseconds.
This is the meaning of the columns:
Reads
- total: The total number of read drives.
- merged: The total number of group readings.
- sectors: The total number of sectors read.
- ms: Total time in milliseconds used to read data from the drive.
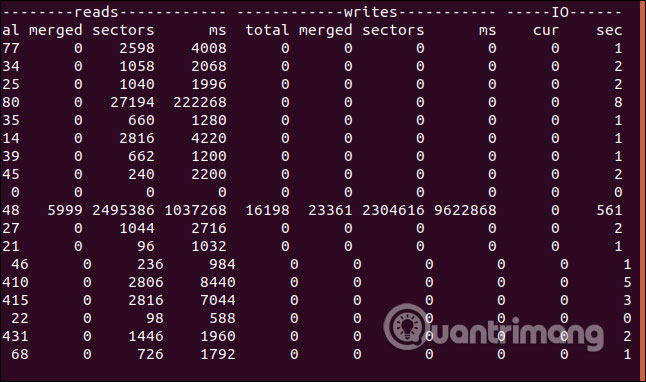
Writes
- total: The total number of drive writes.
- merged: The total number of records grouped.
- sectors: The total number of sectors recorded.
- ms = Total time, in milliseconds, was used to write data to the drive.
IO
- cur: The number of reads or writes of the current drive.
- sec: Time in seconds for any reading or writing being performed.
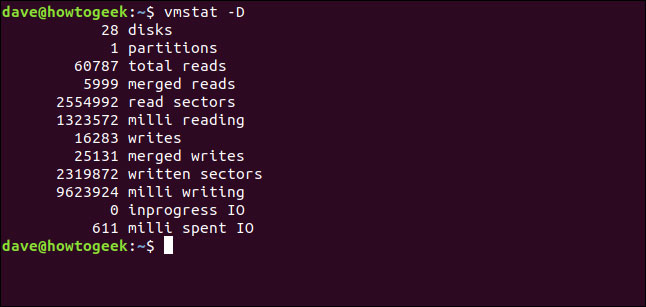
Show summary drive statistics
To quickly display summary statistics for disk activity, use the -D (disk-sum) option. Note that the letter D is capitalized.
vmstat -D

The number of drives may look unusually high. The computer used as an example in this article is running Ubuntu. With Ubuntu, every time you install a Snap application, a file system created with the squashfs pseudo-filesystem will be attached to the device / dev / loop.
The annoying thing is that these device items are counted as hard drive devices by many Linux commands and utilities.
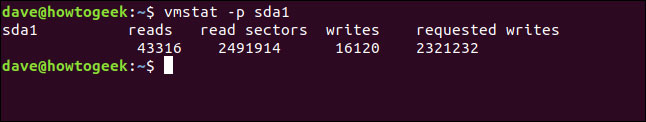
Show partition statistics
To see statistics related to a specific partition, use the -p (partition) option and provide the partition identifier as the command line parameter.
Here we will look at the partition sda1. The first digit indicates that this is the first partition on the sda device , this is the main hard drive for this computer.
vmstat -p sda1

The return information shows the total number of reads, writes the drive to and from that partition, as well as the number of sectors included in the read and write operations.
In-depth understanding of a problem is always encouraged. Sometimes you will try to solve the problem or not care about it anymore (because you just want to know how your computer works).
The vmstat command can give you a lot of useful information. Now, you know how to access this command and its meaning. You need to take some time to learn more and make some diagnoses, to really capture vmstat.
Good luck!
Was this article helpful?
Your feedback helps us improve.
Related Articles
 How to use the which command in Linux8 minutes read
 20+ essential Linux security commands9 minutes read
 14 interesting Linux commands in Terminal7 minutes read
 How to use the stat command on Linux7 minutes read
 Basic Linux commands everyone needs to know28 minutes read
 18 Interesting Linux Commands in Terminal10 minutes read
Reader Comments 0
Sign in with email or Google to join the discussion.