How to use the htop command to monitor system processes in real time
The htop command in Linux is a command line utility that allows users to monitor important system processes in real time.
Table of Contents
The htop command in Linux is a command line utility that allows users to monitor important system processes in real time.
Benefits of htop command
You can track important system resources or processes in real time. The color used in the output makes it much easier to read than the monochrome output of the top command.
Advantages of htop command are:
- Support mouse operation
- Allows you to scroll both horizontally and vertically, to view all processes and to complete the command line
- Lets you end a process without knowing the PID
- Start faster than the top command
- The top command requires you to enter a PID or priority value to change the priority or extend a process, and the htop does not.
Use the htop command
This command is easily called from the Command Prompt:
# htop
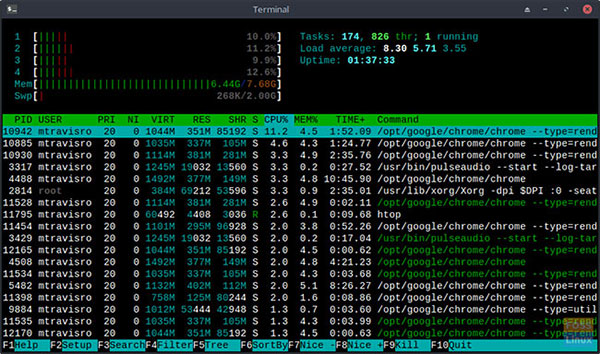
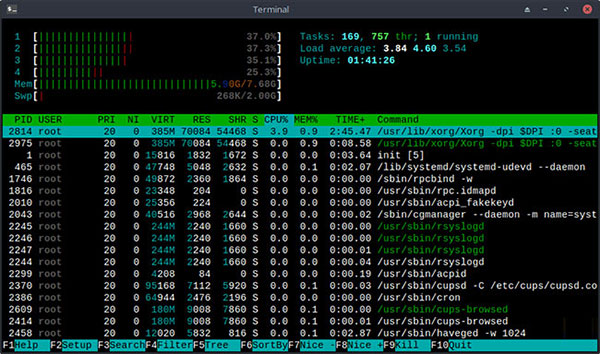
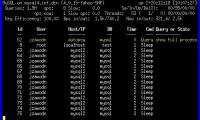
The use of the command is divided into 3 parts.
- In the first section (upper left corner), we see the bars that show the processor usage, the memory in use, and the swap memory (virtual RAM) in use respectively.
- The second part (upper right corner) displays standard information, such as task summary, load average and uptime.
- The last section is at the bottom, where you will see 12 columns, including:
- PID - Process ID
- USER - The process owner's username (or user ID if the name cannot be specified)
- PRI - The kernel's internal priority for the process
- NI - Nice value of a process - from low priority, 19 to high priority, -20
- VIRT - The total capacity of the program in memory
- RES - Resident Set Size (memory that the process uses)
- SHR - The size of the process share page
- S - Process status ( S - sleep / inactive, R - running, D - disk sleep / Drive sleep state, Z - zombie, T - suspended)
- W - Paging (memory management mechanism that allows real address spaces to allocate for scattered, discontinuous processes)
- CPU% - Percentage of CPU processes currently in use
- MEM% - Percentage of process memory currently in use
- TIME + - Time (calculated according to the time the process has taken of system and user time)
- Command - The full path of the command
As with most Linux commands, there are also options.
# htop [-dChusv]
- –D - delay (shows the delay between updates, in 1/10 seconds).
- –C - no-color (monochrome mode)
- –H - help (display the help message and exit)
- –U - user = USERNAME (only shows the progress of a given user)
- –H - pid = PID (shows only the given PID)
- –S - sort-key COLUMN (Sort by this column)
- –V - version (output and exit version information)
You can also use interactive commands while the command is running to change the arrangement / appearance of the window, like:
- Arrow,
Page Up,Page Down,Home,End- Scroll the progress list - Space - tag or untag a process
U- Untag all processess- keep track of system callsF1- HelpF2- SettingF3- SearchF4- FilterF5- Tree viewF6- SortF7- Increase the priority of the selected processF8- Decreases the priority of the selected processF9- Destroy the processF10- Exit (Escalso works)
You can also sort columns simply by using the mouse.
Both new and experienced Linux users should use the man command to see all the features that the command provides.
# man htop
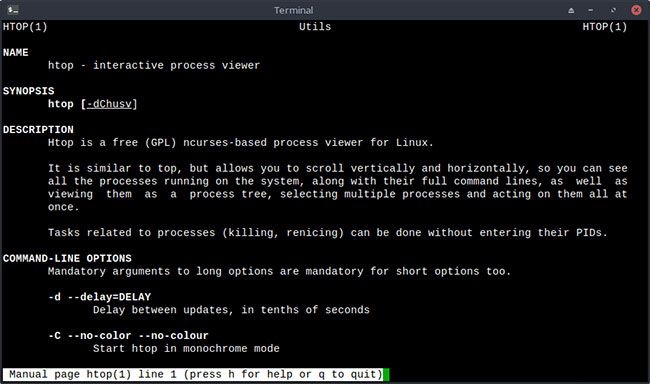
This command is not only an invaluable utility for experienced Linux users' toolkit, but also useful for new Linux users, helping to better understand how Linux works and explore many interesting things. taste.
Was this article helpful?
Your feedback helps us improve.
Related Articles
 Why can htop beat Task Manager?6 minutes read
 Learn about Activity Monitor on Mac14 minutes read
 Monitor MySQL in real-time mode with mytop2 minutes read
 How to run a program periodically using the Watch command on Linux6 minutes read
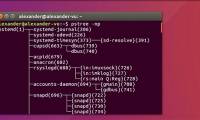 Instructions for using pstree command on Linux4 minutes read
 The best applications to monitor system performance on Android5 minutes read
Reader Comments 0
Sign in with email or Google to join the discussion.