
Figure 1: Error while changing the level when on the Edge server
Network Management - In this series we will show you how to create eye-catching graphical reports from software for Exchange Server.
Introduce
One of the most common requirements from all correspondent administrators around the world is the ability to create comprehensive reports for the environment they manage. If a picture is worth thousands of words then people can easily understand the need to convert thousands of log files that an Exchange server can create into something human-friendly.
Since Exchange Server 2007 (and all previous versions) is unable to create rich graphical reports, there are a few companies that have filled this gap by building reporting software. for Microsoft Exchange.
With Microsoft, the software giant's 2005 release, SQL Server 2000 Report Pack for Microsoft Exchange, is a separate version of Exchange Reporter, a commercial software developed by the company and called SSW. In fact, very few people have used SQL Server 2000 Report Pack for Microsoft Exchange because the requirements of SQL Server and SQL Server Reporting Services are quite high.
Microsoft has taken quite an interesting move with another method. Microsoft Operations Manager (MOM) 2005 with Exchange Server Management Pack has many powerful report generation features. However, Exchange Server Management Pack for the next version of Microsoft management software, System Center Operations Manager (SCOM) 2007 has lost some previous reports still available. However, Microsoft Exchange Server 2007 Management Pack for the latest System Center Operations Manager 2007 R2 provides more than 30 specific reports for Exchange Server 2007 to test availability and performance.
When we decided to introduce this tutorial, we never had the idea of using commercial software, or using the reporting features of system management software but instead we wanted to provide gives you the ability to graphically report to Exchange Server, using a simple and free tool, some from Microsoft, and others developed by Microsoft MVP and some individuals all over the world gender.
All are in the log files
Above I have explained that Exchange Server does not have native graphic reporting features, but this does not mean that it cannot generate the information you need (even more). All are in log files!
What kind of information log files are there in the regular Exchange Server organization? Table 1 below lists the most common records. Note that these logs can be spread across all Exchange servers, because all Exchange roles cannot be located on the same machine.
RecordDefault path
Protocol Logs (SMTP Send)
Exchange ServerTransportRolesLogsProtocolLogSmtpSend
Protocol Logs (SMTP Receive)
Exchange ServerTransportRolesLogsProtocolLogSmtpReceive
Agent Logs
Exchange ServerTransportRolesLogsAgentLog
IIS Logs
[Windows 2003] WindowsSystem32LogFilesW3SVC1
[Windows 2008] InetpubLogsLogFilesW3SVC1
Message Tracking Logs
Exchange ServerTransportRolesLogsMessageTracking
POP3 / IMAP Logs
Exchange ServerClientAccessPopImap
Connectivity Logs
Exchange ServerTransportRolesLogsConnectivity
Pipeline Tracing Logs
Exchange ServerTransport RolesLogsPipelineTracing
Routing Table Logs
Exchange ServerTransportRolesLogsRouting
MRM Logs
Exchange ServerLoggingManaged Folder Assistant
Table 1: General log files in Exchange
The next step is to properly configure the logging, since not all records are enabled by default and one of them needs some adjustments to the calendar data we want to keep.
In this section, we will only use 5 log files from the table above. In these 5 records, there are two records that are not enabled by default: protocol logs: SMTP Send and SMTP Receive. The SMTP transmission logging level is controlled at the Exchange connector level.
To create useful Exchange graphics reports, we assume that the protocol logs from servers on the network boundary are very important, because they register SMTP transaction sessions from incoming or outgoing mail. your organization. In case you deployed the Edge transport server, these logs can be configured from the internal Hub Transport server (if you modify the connector properties from the Edge server, you will get an error like shown in Figure 1).

To enable SMTP Protocol Logs of EdgeSync Send Connectors, open the Exchange Management Console, open Organization Configuration , select Hub Transport, then on the right pane, click the Send Connectors tab. Right-click on the two connectors and select Properties (Figure 2).
On the EdgeSync Connector Properties window, change the Protocol logging level to Verbose (Figure 3).
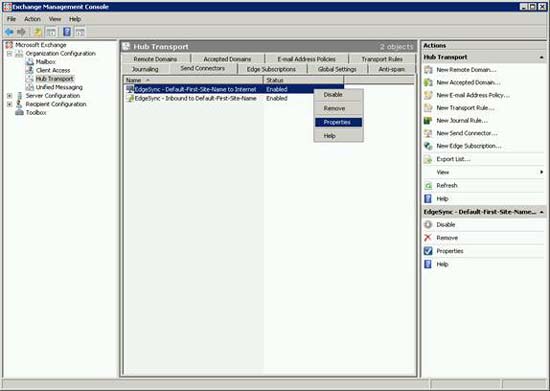
Figure 2: Configuring EdgeSync Send Connector

If you prefer to use PowerShell, run the following command (for both connectors) to set the write level to Verbose (Figure 4):
Set-SendConnector "EdgeSync - Inbound to Default-First-Site-Name" -ProtocolLoggingLevel Verbose

After enabling SMTP Transport Logs, we must define the amount of historical data to keep. Exchange Server allows us to control the maximum log file size, maximum directory size and maximum log file life using the Set-TransportServer command in PowerShell.
The SendProtocolLogMaxDirectorySize and ReceiveProtocolLogMaxDirectorySize parameters specify the maximum size of the Send folder and the Receive Connector Protocol Log. When the maximum folder size is reached, the server will delete the oldest log files. The minimum value is 1MB, the default value is set to 250MB.
Since the default size of 250MB is not enough, let's change the maximum size of the Send Connector folder to 2GB and the Receive connector to 4GB using the Exchange Management Shell command:
Set-TransportServer -Identity E2K7EDGE -SendProtocolLogMaxDirectorySize 2048MB -ReceiveProtocolLogMaxDirectorySize 4096MB
Now that we are ready for our records, this is the time to start analyzing them.
Be aware that, depending on the quality of the data you are analyzing, parsing and processing the logs may take place quickly or slowly.
Parsing logs
Log Parser log parser is a powerful tool, which allows you to query text data such as log files, XML files, CSV files as well as the main data source on the operating system. Windows, Event Log, Registry, file system or even Active Directory. In addition to providing parsing information, Log Parser also results in queries in custom format at the output, such as data datagrid grid, or can be converted into visual charts. .
Log Parser does not need to be installed on Exchange Server, all you need to do is ensure access for Exchange log directories.
Follow the instructions below to install Microsoft Log Parser:
Log Parser has a fairly complete help file (Figure 5), by default located at C: Program Files (x86) Log Parser 2.2, you should read this help carefully. There are also a few examples provided at C: Program Files (x86) Log Parser 2.2Samples for your reference.

In the following sections, we will show you some examples of Log Parser queries used to create the desired visual reports. These queries can be run directly from the command line or you can create batch files different from each query (should be done).
Log Parser usage reports with Agent logs
If you are using Exchange Server's anti-spam agents, there are a few reports we can get by analyzing the Agent logs. These logs are on the Exchange Edge server, if you are using it, or in an Exchange Hub server, in case it has enabled anti-spam agents and is running.
To get the idea of mail coming into your organization, we can start by organizing the number of messages according to their Spam Confidence Level (SCL) and displaying them in a datagrid format.
This is the order to create that datagrid (Figure 6):
"C: Program Files (x86) Log Parser 2.2logparser.exe" "SELECT ReasonData, count (*) AS hits FROM C: Progra ~ 1MicrosoftExchan ~ 1TransportRolesLogsAgentLogAGENT * .log WHERE ReasonData <> NULL GROUP BY ReasonData ORDER BY DESC hits" - i: CSV -nSkipLines: 4 -o: DATAGRID -dtlines: 800 -rtp: -1
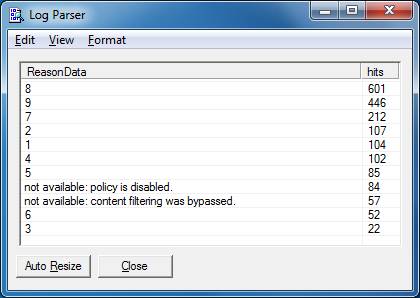
Figure 6: Agent reason spread (Datagrid)
If you like a chart for previous results, it is easy to do. By using the parameter -chartType: PieExplode3D in the command below, we will get a visual diagram as shown in Figure 7.
"C: Program Files (x86) Log Parser 2.2logparser.exe" "SELECT CASE TO_INT (ReasonData) WHEN NULL THEN 0 ELSE TO_INT (ReasonData) END AS ReasonData2, count (*) AS hits INTO agentreasonspread.gif from C: Progra ~ 1MicrosoftExchan ~ 1TransportRolesLogsAgentLogAGENT * .log GROUP BY ReasonData2 ORDER BY DESC hits "-i: CSV -nSkipLines: 4 -o: CHART -chartType: PieExploded3D -chartTitle:" Agent Reason Spread "-e 200 -dtlines: 600
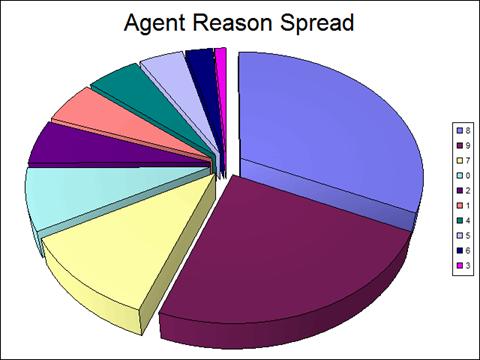
Figure 7: Agent reason spread
Although SCL changes from 1 to 9, but you will see that there is a thin slice of the previous chart with a value of 0. The value 0 represents all disabled policies and content filtering functionality disable (see previous datagrid), meaning that it shows mail coming into your organization.
If you prefer to have a more integrated view of the previous chart, with only accepted mail and removed, the following logparser query will do that. Note that messages with an SCL ratio of 8 or higher will be considered removed, SCL 7 means quarantined, the rest is accepted.
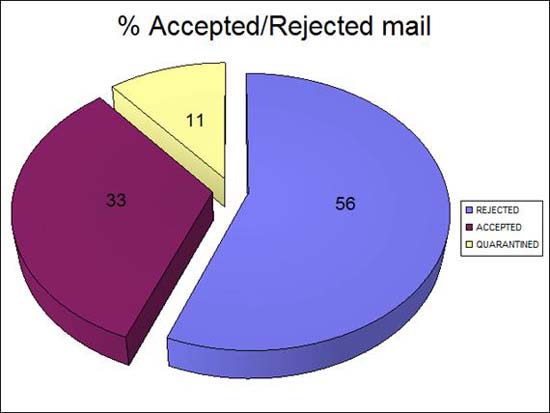
Figure 8:% mail is accepted and removed
Reports with Log Parser with protocol logs
In the next section, we will use SMTP protocol logs. With these protocol logs, we can extract useful information about the partitions of SMTP connections and about hosts (not users).
To get an image of Total Inbound Simultaneous Connections, we will use the code below:
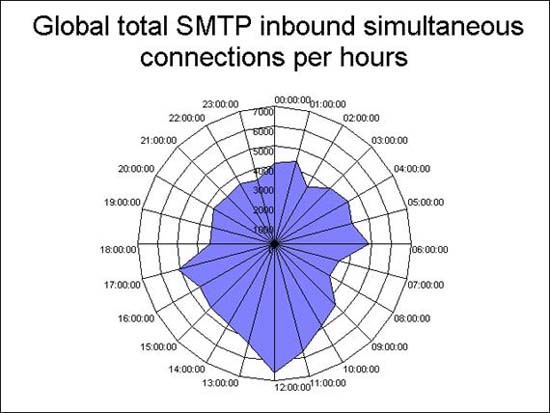
Figure 9: SMTP connections enter
If you like Figure 9 and you like to see a similar chart for outbound connections, the output of the command below is a radar chart described in Figure 10.
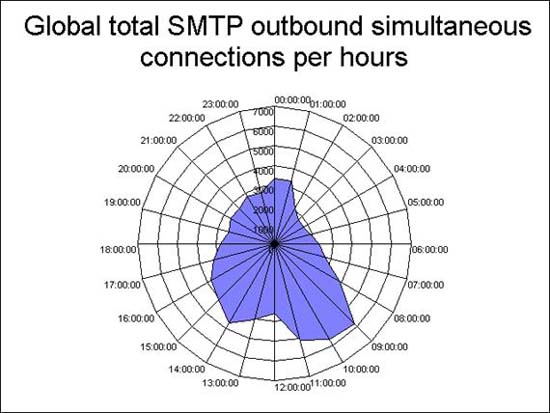
Figure 10: Connections simultaneously come out
The next order analyzes what is the suspect sender to your organization. To accomplish that goal, we need to extract from SMTP Receive Log all hosts that have status codes of 500 and larger, such as 504, 535, 550, .
This process is done in two steps: the first logparser query extracts data from the logs, the second command performs a reverse DNS lookup for the original output. The reason we need to follow these two steps is to take a time-consuming reverse DNS lookup process when extracting data.
Note that there is an internal host on the results described in Figure 11. This host may be an internal application server or an authenticated internal mail forwarding.

We can also create a datagrid with the Top Outbound Rejection Errors by analyzing the SMTP Send Protocol Log. This is useful for identifying outbound errors or in finding whether your server is listed in some blacklist. Here is the command to create the datagrid from Figure 12:
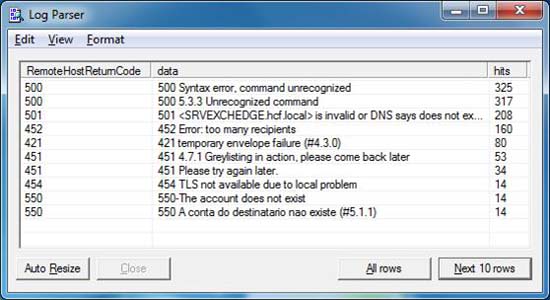
Figure 12: Top rejection errors sent
One of the most desirable reports is the distinction between top senders and organizations. The answer is bundled in these SMTP Receive Transport Logs logs.
Note in the two-step process above, reverse DNS lookup is only performed with the output from the first query, the purpose to optimize the time it takes place.
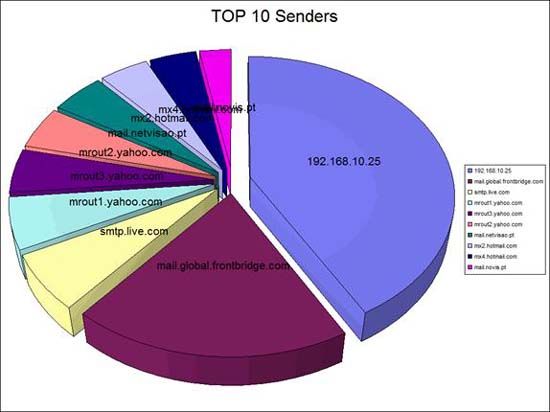
Figure 13: Top sender hosts into the organization
Conclusion
You might be wondering why so many Exchange logs are needed, or you think you might consider unwanted log files, but the work is very useful and is the key to opening all. Your type of information about your mail infrastructure. In the next part of this series, I will show you some Log Parser related issues and prepare for some other queries!