How to Have Some Quick Fun with Sine Waves on Cones
This is a quick workbook and article on sine waves on a cone, slightly modified from the text but not much. Use this design to create fingers and a hand if you like, by choosing which rows to graph, or a Cactus Tree Bar & Grill beveled....
Part 1 of 3:
The Tutorial
-
 Create a new workbook with three worksheets: Data, Chart (unless using Chart Wizard) and Saves.
 -
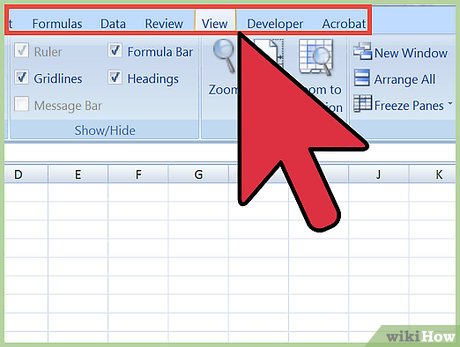 Set Your Preferences: Open Preferences in the Excel menu and follow the directions below for each tab/icon.
- In General, set R1C1 to Off and select Show the 10 Most Recent Documents .
- In Edit, set all the first options to checked except Automatically Convert Date System . Set Display number of decimal places to blank (as integers are preferred). Preserve the display of dates and set 30 for 21st century cutoff.
- In View, click on show Formula Bar and Status Bar and hover for comments of all Objects . Check Show grid lines and set all boxes below that to auto or checked.
- In Chart, allow Show chart names and set Data markers on hover and leave the rest unchecked for now.
- In Calculation, Make sure Automatically and Calculate before save are checked. Set max change to .000,000,000,000,01 without commas as goal-seeking may be done a lot in the future. Check Save external link values and Use 1904 system
- In Error checking, check all the options.
- In Save, select Save preview picture with new files and Save Autorecover after 5 minutes
- In Ribbon, keep all of them checked except Hide group titles and Developer .
-
 It helps by placing the cursor at cell A16 and doing Freeze Panes. Edit Go To cell range A1:C2890 and Format Cells Number Number Decimal Places 4, Font Size 9 or 10,
 -
 Enter the upper Defined Name Variables Section on the Data worksheet
- A1: Enter AjRows
- A2 Enter 2880 and Insert Name Define Name AjRows to cell $A$2.
- A3: Enter Tip
- A4: Enter "=2*PI()" w/o quotes and Insert Name Define Name as Tip for cell $A$4.
- B1: Enter AYE
- B2: Enter BEE
- B3: Enter CEE
- C1: Enter 10
- C2: Enter 1
- C3: Enter .2
- Select cell range B1:C3 and Insert Name Create Names in Left Column, OK.
-
 Enter the column headings of row 5:
- A5: Base t
- B5: Main X
- C5: Main Y
-
 Enter the column formulas
- A6: Enter "=Tip" w/o quotes and Format Fill light rose since its formula is distinct from that of the rest of the column.
- Edit Go To cell range A7:A2886 and enter into A7 w/o quotes the formula "=((A6+(-Tip*2)/(AjRows)))" and Edit Fill Down.
- Edit Go To cell range B6:B2886 and enter into B6 w/o quotes the formula "=((BEE*(1+COS(AYE*A6))*COS(A6)))" and Edit Fill Down. X does not include the Z-dimension.
- Edit Go To cell range C6:C2886 and enter into C6 w/o quotes the formula "=((BEE*(1+COS(AYE*A6))*SIN(A6))*(CEE*(1+COS(AYE*A6))))" and Edit Fill Down. Y includes the Z-dimension by multiplication.
- B2889: Enter "=MIN(B6:B2886)" w/o quotes. B2890: Enter "=MAX(B6:B2886)" w/o quotes.
- Copy B2889:B2890 to C2889:C2890.. The Min-Max info is generally useful with charting.
Part 2 of 3:
Explanatory Charts, Diagrams, Photos
- (dependent upon the tutorial data above)
-
 Create the Charts
- Edit Go To B6:C2886 and from the Ribbon or Chart Wizard select Charts All/Other, Scatter, Smooth Lined Scatter. Leave this chart on your worksheet for now. Here is an image of it with axes, grid lines and the legend removed:
- Do the above step again but copy the resulting chart to the Chart worksheet. Click on the data series until it appears as a formula up in the formula bar and edit it until it reads as follows: "=SERIES(,Data!$E$640:$E$1526,Data!$F$640:$F$1526,1)". This is the upper part of the "plant" or cone, with two side extensions (one of which would be useful as a thumb). Here is a picture of that chart with the unnecessary stuff removed, and a series rows memo for the title:
- Click in the plot area and select Chart Layout, Data Series 1, Format Selection at left. Line is a forest green, 0% transparent, 40 pt weight. Glow is yellow size 53 pt, 65% transparent, 0 soft edges. No Shadow, etc. OK.
- Click in the plot area and do Chart Add Data and in response to the query dialog box, respond with B6:C2886 from the Data worksheet. This may not happen correctly so make sure that you get "=SERIES(,Data!$B$6:$B$2886,Data!$C$6:$C$2886,1)" in the formula bar. Use Shift+Option to create another one like it atop the other lower branch of the cactus, then create two smaller versions at the tips of the taller cactus "fingers."
- You can observe what was done and use your own imagination to make your own cactus flowers. Inner yellow line weight of yellow 10 was used, with a red and then orange glow on left and right respectively. On the top ones, soft edges were used a little bit, with left green and right yellow glow to left white and right blue inner 10 pt weight line.
- For the Plot Area Fill, use the Color Wheel and select Blue at the very outside center then on the Lightness-Darkness (Value) Bar, darken to a dark blue(-purple?) at about 60% of the way down the bar towards black. Here is a picture of the Color Wheel:
- I then used Grabber app to get a picture of the entirety but another way to go is to select on the main cactus and hold down the shift key and use Format Arrange and GROUP the various data objects in the chart and then they will all copy under a shift+copy = Copy Picture and shift + Paste = Paste Picture. Then you can use Format Picture and Picture Styles to get the coaster effect, plus add beveling under beveling effects (at 16 width and height as I recall).
- Finished! Have fun with it!!

Part 3 of 3:
Helpful Guidance
-
 Make use of helper articles when proceeding through this tutorial:
- See the article How to Create a Spirallic Spin Particle Path or Necklace Form or Spherical Border for a list of articles related to Excel, Geometric and/or Trigonometric Art, Charting/Diagramming and Algebraic Formulation.
- For more art charts and graphs, you might also want to click on Category:Microsoft Excel Imagery, Category:Mathematics, Category:Spreadsheets or Category:Graphics to view many Excel worksheets and charts where Trigonometry, Geometry and Calculus have been turned into Art, or simply click on the category as appears in the upper right white portion of this page, or at the bottom left of the page.