How to Solve Random Beads, Overlapping Spiral, Asymptotic Axes Problems
In this article, you'll learn how to solve the old problems of Random Beads in a Ring, the Overlapping Spiral and the Asymptotic Axes Problems by following the steps below to make images like this one. Become familiar with some of the...
Table of Contents
Part 1 of 3:
The Tutorial
-
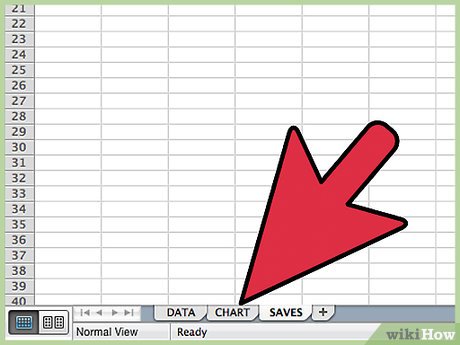 Create a new Excel workbook with three worksheets: Data, Chart (unless using Chart Wizard) and Saves. Save the workbook under a logical file name into a logical file folder.
 -
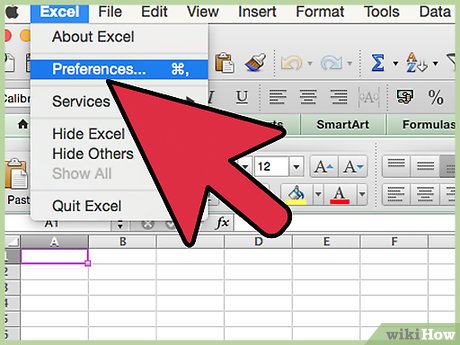 Set Your Preferences: Open Preferences in the Excel menu and follow the directions below for each tab/icon.
- In General, set R1C1 to Off and select Show the 10 Most Recent Documents .
- In Edit, set all the first options to checked except Automatically Convert Date System . Set Display number of decimal places to blank (as integers are preferred). Preserve the display of dates and set 30 for 21st century cutoff.
- In View, click on show Formula Bar and Status Bar and hover for Comments of all Objects . Check Show grid lines and set all boxes below that to auto or checked.
- In Chart, allow Show chart names and set Data markers on hover and leave the rest unchecked for now.
- In Calculation, Make sure Automatically and Calculate before save are checked. Set max change to .000,000,000,000,01 without commas as goal-seeking is done a lot. Check Save external link values and Use 1904 system
- In Error checking, check all the options.
- In Save, select Save preview picture with new files and Save Autorecover after 5 minutes
- In Ribbon, keep all of them checked except Hide group titles and Developer .
-
 It helps by placing the cursor at cell A16 and doing Freeze Panes. Select the entire worksheet by selecting between the A of column A and the 1 in Row 1 in the top left corner and Format Cells Number Number Decimal Places 4, Font Size 9 or 10,
 -
 Enter the upper Defined Name Variables Section on the Data worksheet - there are pictures of the Data section below.
- Cell A1: Enter CONSTANTs and VARIABLEs
- A2: t
- A3: c_
- A4: AdjRows
- B2: Enter 1000 and Insert New Comment "Currently trying 1,000.00 with good results except Spheres have rougher edges than if I use 968,152 ...Try =(2*3*5*7*11*13*17)= 510510 but spheres too thin at higher Sphere-Count? NEW DEFAULT= 968152 (with var c at about 17150.39 brings t_rng/c to 9π!!!). OLD Default = 968115". Format Cell Fill Yellow (for input).
- B3: Enter "=VLOOKUP(Spheres,Spheres_Lookup,3)" w/o quotes and Insert New Comment, "Formula is: =VLOOKUP(Spheres,Spheres_Lookup,3).INPUT of 36 into Spheres variable in cell C5 below brings this to 17120.69 …. the approximate default.Default was = 17120. Value of =17120.6863050705 brings t_rng/2c to 9π!! You might say, "What a strange value!" and the same about variable "t" above .. "Why 968,152.00?" The answer is that "These graphs exist only in very narrow ranges of value settings!! It took me years to find sets of them!"
- B4: Enter 1439 and Insert New Comment, "Default = 1439. 1441 (actual rows of data) is OK but Spheres are thinner."
- Select cell range A2:B4 and Insert Names Create Names in Left Column, OK.
- C2: Enter Converter
- C3: Enter Chgr (for Changer)
- C4: Enter Factor
- D1: Enter Instrux:
- D2: Enter "=PI()/180" w/o quotes
- D3: Enter "=VLOOKUP(Spheres,Spheres_Lookup,2)" and Insert New Comment, "Formula is =VLOOKUP(Spheres,Spheres_Lookup,2)Default for Golden Mean Long Leg is =0.618033988749895; for more info, see note in cell Q1"
- D4: Enter .25 and Insert New Comment, "Default = .25 This is because there are 1440 rows approx, so 1440*.25 = 360 for sin and cos functions to calculate naturally over. When variable "Factor" > .250, then the circles OVERLAP, eg. When Factor = .50, and Spheres=36, 18 spheroids overlap base 18; when Factor has input of "=1/3", then the first 27 spheres form a circle but the last 9 spheres (27+9=36) OVERLAP. When Factor
- Select cell range C2:D4 and Insert Names Create Names in Left Column, OK.
- B5: Enter INPUT RANGE [1 to 80]:, aligned right.
- C5: Input 40 and Format Cells Number Number Custom "Spheres: "0 with quotes and Format Cells Fill Yellow Font Red Bold, Size 14.
- E1: 1) Save this workbook of sheets under a new name (leave yourself original to revert to).
- E2: 2) Select a YELLOW-HiLite cell like cell C5, Spheres. Input 1 (not "Spheres: 1").
- E3: 3) Learn from Comments by putting cursor over cell w/ red triangle in upper right.
- E4: 4) Try using Tools-Goalseeking to bring cell J10 = to 6 by changing Resize Circle Radius in cell I7.
- E5: 5) Try decimals and negative numbers.
- E6: 6) Revise the formulas! .. If you dare?
- E7: 7) Save nice pix to 'Saves' sheets.
- H5: POWER
- H6: Spirallate_Circle
- H7: Circle
- I5: Enter 1 and Insert New Comment, "Default is 1. Try 2, 3, .5, .001, etc. Then try w/ Spheres=1 or 2 or low #."
- I6: Enter N and Insert New Comment, "Default is "N" for NO. Try inputting "Y" for YES (w/o quote marks). Get MORE SPIRAL TURNS by increasing Variable "Factor" say to .5 or .8 in cell D4!! TRY "Y" HERE AND SPHERES=2 TO SEE 1 SPHERE 'INSIDE' ANOTHER ONE"
- I7: Enter 1 and Format Cell Number Number Custom "Radius="#,##0.000000 w/ quotes. Select cell range I5:I7 and Format Fill yellow w/ Font Red bold.
- Select cell range H5:I7 and Insert Names Create Names in Left Column, OK.
- J1 and K1: [sin(t range/2c)
- J2: * cos(t range) and K2: * sin(t range). Format Fill J2:K2 light blue.
- J3 and K3: * cos(t range/2c)
- J4 and K4: * Chgr^3 ]
- J5: + Cos(Row*Factor and K5: + Sin(Row*Factor. Format Fill J5:K5 light blue.
- J6 and K6: *Converter)*Circle
- J7: Lt Blue above denotes J,K formula differences.
- M7: "=0.618033988749895" and Format Cells Number Number Custom "GMLL: "0.000000000 with quotes. Insert Name Define Name GMLL to cell $M$7. Insert New Comment, "This stands for 'Golden Mean Long Leg'. The Golden Mean exists when distances a and b are related such that a:b as b:(a+b). 1-GMLL gives the GMSL or Short Leg."
- Otherwise, Columns M and N have been omitted from this article for the sake of brevity; they calculated Total Spirallic Distance and Actual Radius. Columns O-Q are part of the Spheres_Lookup table and will be covered next. Columns R-U are part of a fancy Goal Seeking scheme. Columns Vand W have to do with a Curve Components Chart I'm not including within this article for the sake of brevity. Columns X and Y have to do with Random Beads and will be covered later. Lastly, Column Z is a former Lookup3 for variable c = Q table series, unnecessary to the current work.
-
 Enter the Spheres_Lookup Table
- O1: Enter Spheres_Lookup
- P1: Enter MagicNumber
- Q1: Enter 0.636619772367581 or "2/PI()" w/o quotes and Copy and Paste Special Values back to the same cell. Insert Name Define Name MagicNumber to cell $Q$1. Insert New Comment, "©CG: This is THE MagicNumber!!!!! Do NOT change, spindle or mutilate, PLEASE! I'm still trying to figure it out! The MagicNumber is 2/π !!!!! Or, think of it this way: π*.63662=2.0"
- O2: Enter Spheres
- P2: Enter V: Changer 'Chgr'
- Q2: Enter Variable 'c' = Q
- Edit Go To cell range O3:O82 and enter 1 and do Edit Fill Series Column Linear Step Value 1 OK. Select cell O83 and input 101.321183642338 and select cell O84 and input 202.642367284676 and select cell O85 and input 360.
- Here are the table input pictures for column P; where you see .618034, that means to input "=GMLL". Column Q is formulaic - do not enter Column Q. The bottom number in Column P to the right of 360 is 0.0281510429528001 (achieved via a Goal Seeking method).
- Q3: Enter "=t*MagicNumber"
- Edit Go To cell range Q4:Q85 and enter into Q4 w/o quotes "=$Q$3/O4" and Edit Fill Down.
- Edit Go To cell range O3:Q85 and Insert Name Define Name Spheres_Lookup to cell range $O$3:$Q$85.
-
 Enter the column headings of rows 8 and 9:
- A9: Enter t range
- B8: Enter Constant and B9: Enter 2*c
- C9: Enter t rng/2c
- D8: Enter sin and D9: Enter (t rng/ 2c) = D
- E8 Enter cos and E9: Enter (t rng) =E
- F8: Enter sin and F9: Enter (t rng) =F
- G8: Enter cos and G9: Enter (t rng/2c)=G
- H8: Enter H= cos((Row-10)* and H9: Enter Factor*Converter)*Circ
- I8: Enter: I= sin((Row-10)* and I9: Enter Factor*Converter)*Circ
- J8: Enter (D*E*G*Chgr^3)+H and J9: Enter Charting X
- K8: Enter (D*F*G*Chgr^3)+I and K9: Enter Charting Y and Format Fill J8:K9 light green.
- L7: Enter SPIRALLATE: and L8: Enter PERCENTAGE and L9: Enter METHOD
- X7 and Y7: Enter OR
- X8 and Y8: Enter REDEFINE
- X9 and Y9: Enter Chgr (either column X or Y may be used by Insert Name Define Name Chgr to the Column's values)(otherwise, Chgr is defined as $D$3, as it is right now).
-
 Here are pictures of the Variables Section, Column Headers and first few rows of data:
 -
 Enter the column formulas
- A10: Enter "=t*IF(Spheres=ODD(Spheres),0,1)" w/o quotes. Format bold.
- A11:A1450 Enter "=A10-((2*t)/AdjRows)" w/o quotes to cell A11 and Edit Fill Down.
- B10: "=2*c_" w/o quotes and enter to B11 of B11:B1450 "=B10" and Edit Fill Down.
- Edit Go To cell range C10:C1450 : Enter to C10 "=A10/B10" and Edit Fill Down.
- Edit Go To cell range D10:D1450 : Enter to D10 "=SIN(C10)" and Edit Fill Down.
- Edit Go To cell range E10:E1450 : Enter to E10 "=COS(A10)" and Edit Fill Down.
- Edit Go To cell range F10:F1450 : Enter to F10 "=SIN(A10)" and Edit Fill Down.
- Edit Go To cell range G10:G1450 : Enter to G10 "=COS(C10)" and Edit Fill Down.
- Edit Go To cell range H10:H1450 : Enter to H10 "=(COS((ROW()-10)*Factor*Converter)*Circle)" and Edit Fill Down.
- Edit Go To cell range I10:I1450 : Enter to I10 "=(SIN((ROW()-10)*Factor*Converter)*Circle)" and Edit Fill Down.
- Edit Go To cell range J10:J1450 : Enter to J10 "=((((D10*E10*G10*Chgr^3)+H10)/IF(Spheres=1,28.860828*n, IF(Spheres=2,28.860828*n,1)))*IF(Spirallate_Circle="Y",L10,1))^POWER" and Edit Fill Down.
- Edit Go To cell range K10:K1450 : Enter to K10 "=((((D10*F10*G10*Chgr^3)+I10)/IF(Spheres=1,28.860828*n, IF(Spheres=2,28.860828*n,1)))*IF(Spirallate_Circle="Y",L10,1))^POWER" and Edit Fill Down.
- Edit Go To cell range L10:L1450 and enter to L10 .01 and enter to L1450 1 and do Edit Fill Series Columns Linear Step Value Trend, OK. Format Cells Number Number Percentage, Decimal Places 6.
- [If you're interested, the formula for the TOTAL SPIRALLIC DISTANCE in cell M11 of M11: M1450 is =((J11-J10)^2+(K11-K10)^2)^0.5. An interesting line plot can be made of the data.]]
- [If you're interested, the formula for the AVERAGE (gives average) ACTUAL RADIUS in cell N10 of N10: N1450 is =((J10-0)^2+(K10-0)^2)^0.5
- [If you're interested, the formula in cell R3 is =t/(2*Q3) of R3:R85]
- [If you're interested, the formula in cell S3 is R3/PI() of S3:S85]
- [If you're interested, the series in cell range T3:T82 starts with .25 and increments by .25 until it reaches 20. The last 3 values are 25.3302959105844, 50.6605918211689 and 90.]
- [If you're interested, but since obviated by the finding of the MagicNumber, the GoalSeeking to zero column U has the Inserted Comment in U3, "By using the TOOLS-Goalseek function and setting this cell TO equal 0 by CHANGING corresponding column Q cell, I get S = T; U=0.000000n, or approx. ZERO.ZERO !!! By so doing, I get S at (t/2Q)/∏ to be a nearly perfect factor of PI!!"]
- [If you're interested, and used for a Curve Components Sine Wave Chart, the formula in V10 of V10:V1450 is =((((D10*E10*G10*Chgr^3))/IF(Spheres=1,28.860828*n, IF(Spheres=2,28.860828*n,1)))*IF(Spirallate_Circle="Y",L10,1))^POWER]
- [If you're interested, and used for a Curve Components Sine Wave Chart, the formula in W10 of W10:W1450 is =((((D10*F10*G10*Chgr^3))/IF(Spheres=1,28.860828*n, IF(Spheres=2,28.860828*n,1)))*IF(Spirallate_Circle="Y",L10,1))^POWER]
- Edit Go To cell range X10:X1450 : Enter to X10 w/o quotes "=IF(((ROW()-10)/(Spheres*2))=ROUND((ROW()-10)/(Spheres*2),0), ROUND(RAND()*10,0)/10,X9)" and Edit Fill Down.
- Edit Go To cell range Y10:Y1450 : Enter to Y10 w/o quotes "=SQRT(X10/PI())" and Edit Fill Down.
Part 2 of 3:
Explanatory Charts, Diagrams, Photos
- (dependent upon the tutorial data above)
-
 Create the Charts
- Edit Go To J10:K1450 and from the Ribbon or Chart Wizard select Charts All/Other, Scatter, Smooth Lined Scatter. Leave this chart on your worksheet for now. Here is an image of the Preliminary Chart with axes, grid lines and the legend removed. You may have to set the Scale to ±1.5 or so to get good roundness.
- Random Beads Chart: Change the definition of Chgr from D3 to Insert Name Define Name Chgr for $X$10:$X$1450. Set Circle or Radius to = 4. You'll have to reopen the scale to defaults and perhaps reset the vertical to ± 5 or so. Your chart won't look like mine due to randomness. Hold down the Command key and tap the = key until you get an arrangement you like. Using Chart Layout, get rid of the default axes, legend and grid lines, unless you want to add shadow to the axis w/o numbers. That requires removing the linked to source checkmark and any pre-set number of decimal places and formatting them like this: ;;; Also get rid of the Plot Area and Chart Area default Line. You can set gradient to whatever you like, radial or path, centered, with as many colors as you like -- I used black at the tips and formatted the plot area to have a radial glowspot in blue and purple at the center. My line gradient went Black Red, Pink, Blue, Black. I set the Shadow to Perspective, Size 70%, Blur 0, Distance 0, Transparency 71% for Series 1. For the Plot Area, I also had A medium solid Blue at size 45 pt, 25% transparent, soft edges, 29 pt. And Plot Area Fill was left blue, then Pink in a tight band captured on the left by another blue and o the right by black. with 61% transparency, radially centered. 3D Format was Depth and Surface, Surface Material Powder. For Chart Area, I had Fill White with 0% transparency. I did a Copy Picture with the Shift Key and Paste Picture with the Shift Key and double-clicked on it and chose Picture Style as you see, once I had copied and pasted it atop my data worksheet and copied and pasted that picture. I had also added a Title about the file and the critical variable settings. Here is another view of that chart.
- Overlapping Spiral Chart: Reset Chgr to Insert Name Define Name Chgr to $D$3. I had to rescale the chart to -.75 to .50 on the Vertical and -1, 1 on the Horizontal. Variable Factor was set to .50 and Radius was set to .50 -- Here are some pictures of that chart.
- Asymptotic Axes Chart: Set Power to 3. Reset the axes to defaults if Radius = 1 and Factor = .5 while Power = 3.. Here is a picture of that chart. Of course the Title info is wrong, but those are the breaks ....


Part 3 of 3:
Helpful Guidance
- Make use of helper articles when proceeding through this tutorial:
- See the article How to Create a Spirallic Spin Particle Path or Necklace Form or Spherical Border for a list of articles related to Excel, Geometric and/or Trigonometric Art, Charting/Diagramming and Algebraic Formulation.
- For more art charts and graphs, you might also want to click on Category:Microsoft Excel Imagery, Category:Mathematics, Category:Spreadsheets or Category:Graphics to view many Excel worksheets and charts where Trigonometry, Geometry and Calculus have been turned into Art, or simply click on the category as appears in the upper right white portion of this page, or at the bottom left of the page.
Was this article helpful?
Your feedback helps us improve.
Related Articles
 The 9,000-year-old ax sheds light on the ancient burial custom2 minutes read
 Asymptotic analysis in Data Structures and Algorithms5 minutes read
 How to use Coc Coc to solve math problems online4 minutes read
 How to show or hide chart axes in Excel4 minutes read
 Coreldraw 12 - Lesson 8: Spiral drawing tool2 minutes read
Reader Comments 0
Sign in with email or Google to join the discussion.