Comparing Excel Agent Mode and Claude Excel Add-in: Which AI builds better financial models?
Today, we'll explore a question many financial modelers have been quietly asking for a long time: Can AI now build a complete financial model directly in Excel?
Table of Contents
Both Excel's new Agent Mode and the Claude Excel Add-in claim to be able to generate complete 3-report financial model sets with valuations from a single natural language statement.
Summary of modeling
To check how far this capability has actually progressed, both tools are provided with the same prompt:
Build a fully integrated 3-statement model with a complete DCF valuation, clean assumptions, proper working-capital logic and a 10-year forecast.Both tools generate multi-tab Excel spreadsheets in seconds. Below, this article will examine what each tool has produced, what works, what fails, and whether which model is ready for real-world financial modeling.
Note : Please refer to the full prompt below:
Create a fully integrated, investment-grade 3-statement financial model with a complete discounted cash flow (DCF) valuation. The workbook should contain three worksheets—ASSUMPTIONS, CALCULATIONS, and DCF VALUATION—using professional formatting and fully dynamic formulas. ASSUMPTIONS Tab Build a clean, clearly structured input sheet. All assumption cells must be formatted in BLUE font or blue fill, with labels in black. Include the following inputs: • Company name, model start year and forecast period (Years 1–10). • Revenue model: starting revenue, annual revenue growth % by year. • Cost of Goods Sold (COGS) as % of revenue. • Operating Expenses: SG&A, R&D and Other OPEX as % of revenue. • Working capital drivers: DSO, DIO, DPO. • Capital Expenditure (CAPEX) as % of revenue. • Depreciation assumptions: rate, useful life, and depreciation method. • Corporate tax rate. • Terminal growth rate (1–4%). • Full WACC inputs: ◦ risk-free rate ◦ equity risk premium ◦ beta ◦ cost of equity (calculated) ◦ cost of debt ◦ target D/E ratio ◦ calculated WACC (ensure formula-driven) Use data validation dropdowns where relevant (e.g., depreciation method). CALCULATIONS Tab Build dynamically linked financial statements referencing only the ASSUMPTIONS tab. Use BLACK font for calculated cells and apply consistent number formats. Income Statement Compute: Revenue, COGS, Gross Profit, OPEX, EBITDA, D&A, EBIT, Interest, EBT, Taxes, Net Income. Include year-over-year % changes. Balance Sheet Model working capital from assumptions: • Accounts Receivable = Revenue × DSO / 365 • Inventory = COGS × DIO / 365 • Accounts Payable = COGS × DPO / 365 Model PP&E roll-forward, CAPEX, depreciation and equity balances. Cash Flow Statement Build indirect method: • Operating CF: Net Income + D&A ± working capital movements • Investing CF: CAPEX • Financing CF: interest, debt changes (if any) • Calculate Free Cash Flow to Firm (FCFF): EBIT × (1 – tax rate) + D&A – CAPEX –ΔWC Ensure all rows and sections use bold headers, borders, and consistent currency formatting. DCF VALUATION Tab Construct a complete DCF: • Forecast FCFF for all years. • Discount factors using WACC. • Present Value of FCFF. • Terminal Value = Final-Year FCFF × (1 + g) / (WACC – g). • PV of Terminal Value. • Enterprise Value = sum of PVs. • Equity Value = EV – Net Debt. Add a two-way sensitivity table with: • Rows: WACC from 6%–12% • Columns: terminal growth 1%–4%. Apply conditional formatting to highlight negatives in red and shade section headers. Build the model so every formula is transparent, auditable, and fully driven by the Assumptions tab. The model was created by Excel Agent Mode.
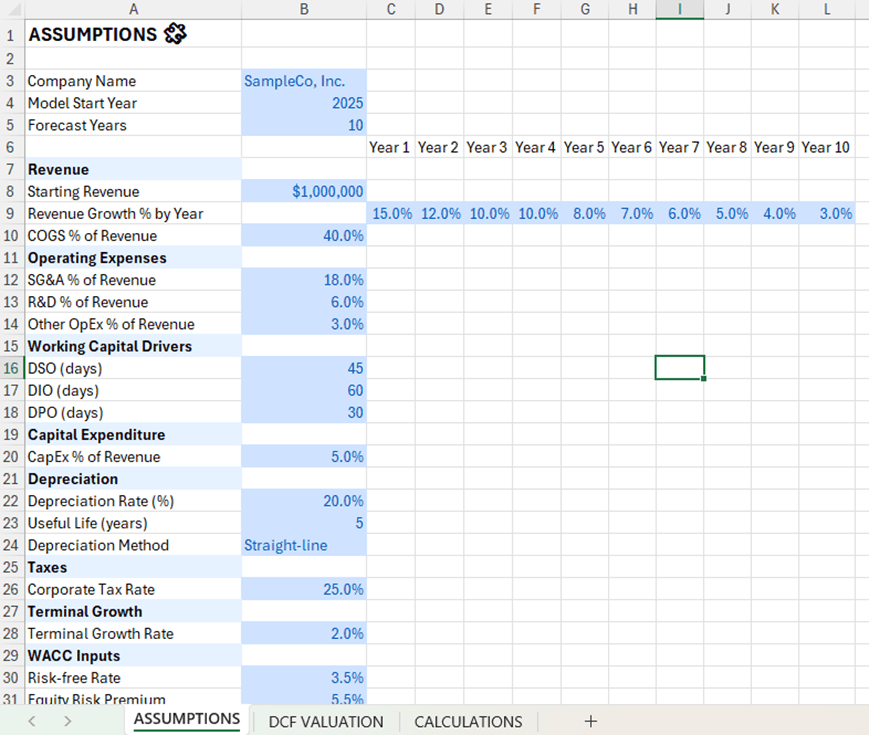
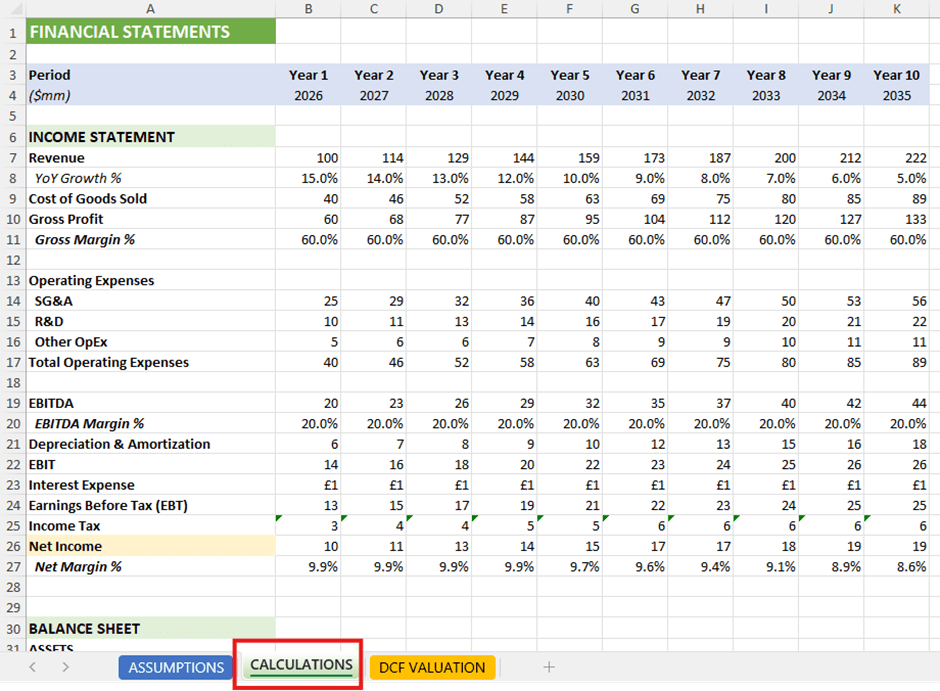
Agent Mode has created a simple yet fully functional spreadsheet with 3 main tabs:
- ASSUMPTIONS
- CALCULATIONS
- DCF VALUATION.
1. Assumption
Agent Mode used actual, coherent, and internally consistent input data:
- Revenue growth slowed from 3% to 15%.
- A reasonable cost structure with a suitable profit margin.
- Standard working capital ratio
- Capital investment costs are at 5% of revenue.
- Depreciation is calculated using the straight-line method at 20%.
- The standard corporate tax rate is 25%.
Nothing felt overly extreme or arbitrary. For a model based on only one input, this was very encouraging.
2. Core Computing
Agent Mode has correctly handled revenue, gross profit margin, operating expenses (OPEX), and earnings before interest and taxes (EBIT). The working capital logic calculated using the formula is sound. So far, everything is going well.
However, fixed assets (PP&E) showed inconsistencies. Depreciation and net book value (NBV) were sometimes calculated from revenue and sometimes from the existing fixed asset balance. The variable calculation table was inconsistent with the standard structure:
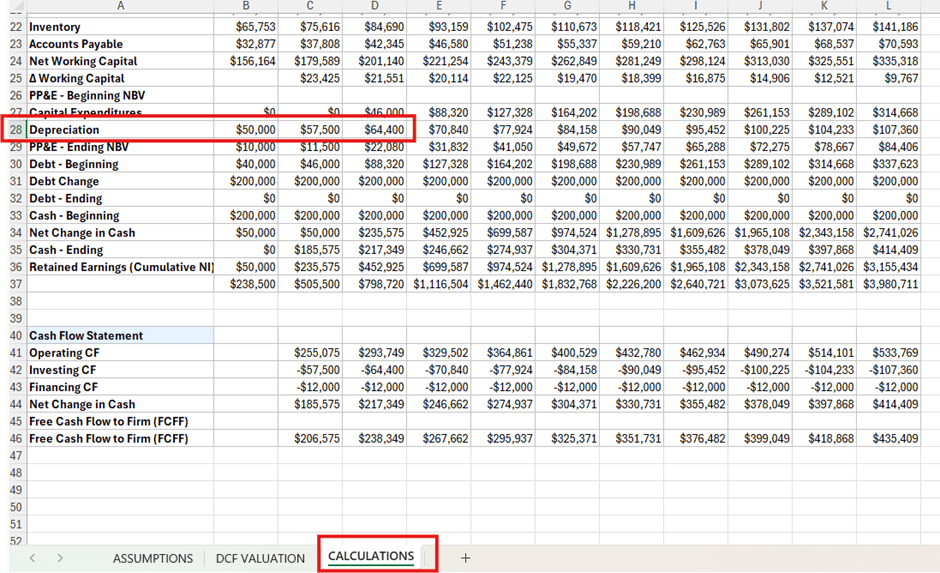
Spreadsheets work, but that's not something we'd accept in a manufacturing quality model.
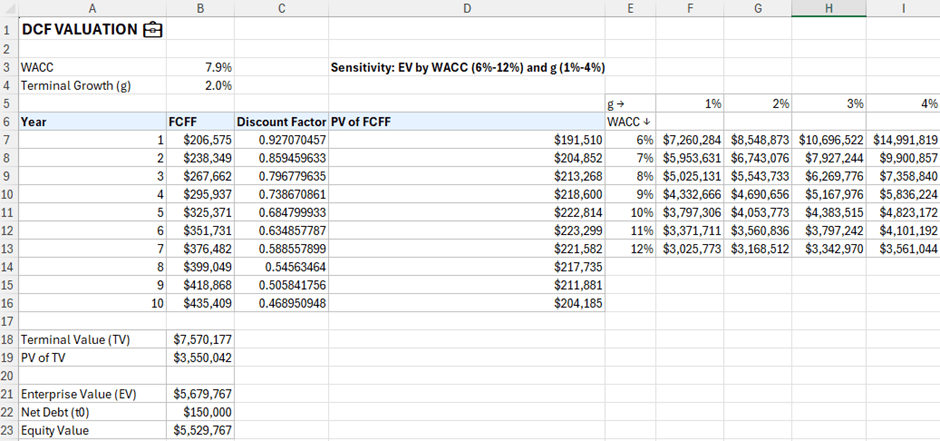
3. FCFF and DCF
Despite some weaknesses in the input section, the discounted cash flow (DCF) tab is the strongest part of the spreadsheet.
The weighted average cost of capital (WACC) was calculated using a standard methodology and applied consistently throughout the valuation process. Net debt and equity matched clearly, with no unexplained balance items. The WACC-growth sensitivity analysis also performed as expected, with assumed changes accurately conveyed.
The model was created using the Claude Excel Add-in.
In Claude's model, the format is neat and the input data is grouped logically. However, fundamental financial theory tells a different story.
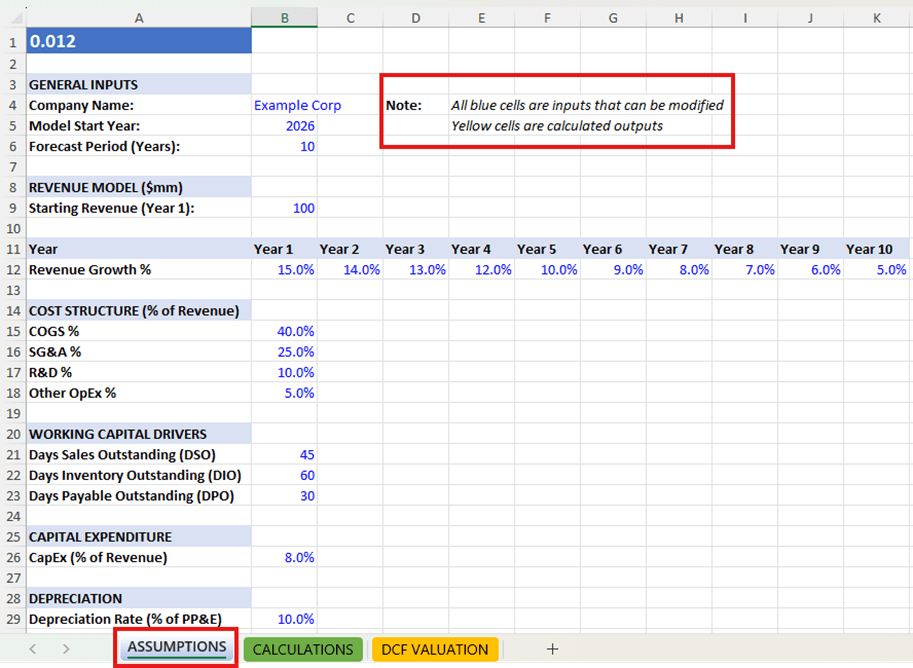
1. Assumption
Although Claude's input data is visually well-organized, several key issues have been identified:
- The equity risk premium was set at 120%, rather than the typical 5% to 6%.
- The beta coefficient is generated through a formula that does not follow standard market logic.
- The cost of debt is 30%, which is unrealistic for most companies.
- WACC is not calculated using standard methods.
The layout looks professional. But the assumptions are not.
2. Calculation
Claude's income statement, depreciation, and working capital report are presented neatly and are easy to read.
The problems are:
- Cash is used as a balancing factor, which is accepted in the templates but not in the valuation.
- Changes in working capital and cash flow from operating activities are referenced to inaccurate ranges.
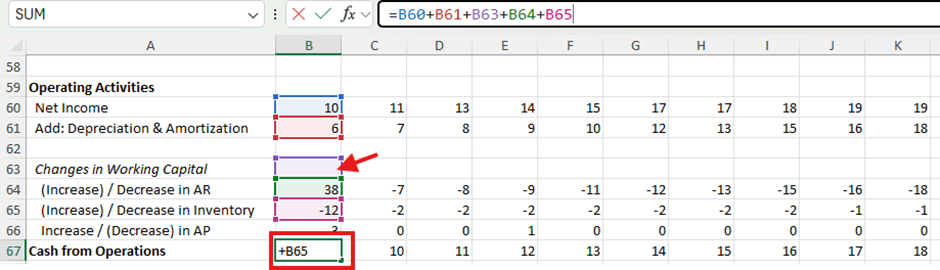
- The cost of capital investment is linked to incorrect cells.
These issues make the cash flow generated mathematically unreliable.
3. DCF
Claude's DCF table looks very good at first glance. The discount table is clearly presented, the present value columns are neat and easy to follow, and the sensitivity analysis is well-presented.
However, upon tracing the origins of the figures, the problems became apparent. Free cash flow to the business (FCFF) was inaccurate due to errors in the input costs of capital investment and changes in working capital. These issues directly impacted the valuation, meaning that all discounted cash flows were constructed on erroneous input data.
More importantly, the discounting logic itself is flawed. Cash flows are discounted using the debt-to-equity ratio instead of the weighted average cost of capital, while end-of-period value is discounted using the WACC. This inconsistency breaks the internal logic of valuation and produces an inaccurate equity value.
In short, Claude presented the material very well, but the financial logic failed at the most critical stages, where accuracy was paramount.
Helpful advice
After examining both spreadsheets in detail, the differences between the two tools become very clear. AI tools have different characteristics when working with financial modeling.
In terms of structure and readability, Claude performs better. Its layout is cleaner, input data is grouped logically, and the model is generally easier to audit. Excel Agent Mode is simpler and more functionally focused.
However, when it comes to financial model logic, Excel Agent Mode is stronger in the truly important areas. WACC is calculated accurately, discounts are applied consistently, free cash flow adheres to standard definitions, and the end-of-period value logic is sound. Claude's model, while attractively structured, miscalculates several fundamental metrics, including WACC and free cash flow, which undermines the entire valuation process.
The realism of the assumptions is another clear differentiating factor. Agent Mode uses input data that closely resembles real-world corporate financial assumptions and falls within reasonable limits.
These differences also affect the feel of working with each tool. Agent Mode functions like a reliable calculator, but its presentation capabilities are limited. Claude functions like a junior analyst with excellent formatting and structuring skills.
For those who practice modeling, the implications are clear. Both tools can accelerate the initial modeling phase, but neither can operate automatically. Assumptions still need to be reviewed, fixed assets and depreciation schedules must be validated, WACC logic needs careful examination, and working capital fluctuations often need to be rebuilt. Free cash flow and discounted cash flow are never accepted without verification.
AI can now build the first draft, but you still need to build the final model yourself.
Was this article helpful?
Your feedback helps us improve.
Related Articles
 Comparing Claude vs ChatGPT: Which is the better AI chatbot?11 minutes read
 Template agent Financial Insights7 minutes read
 What is Claude Skills?12 minutes read
 How to test your financial plan in various situations with Claude.9 minutes read
 Comparing two leading AI models: DeepSeek and Claude.11 minutes read
 The difference between Claude and ChatGPT12 minutes read
Reader Comments 0
Sign in with email or Google to join the discussion.