Capture execution diagrams with SQL Server 2005 Profiler
Executable diagrams are one of the best tools for diagnosing query errors in order to adjust the execution of queries on SQL Server. In previous versions of SQL Server 2005, the only option for query performance was text diagrams or graph execution diagrams for manual queries. On SQL Server 2005, you can capture execution plans in two ways.
Tim Chapman
Executable diagrams are one of the best tools for diagnosing query errors in order to adjust the execution of queries on SQL Server. In previous versions of SQL Server 2005, the only option for query performance was text diagrams or graph execution diagrams for manual queries. On SQL Server 2005, you can capture execution plans in two new ways that will give you more capabilities to diagnose and tune database queries.
You can identify query execution diagrams through a trace on SQL Server and through dynamic management windows. In this article, we will use SQL Server 2005 Profiler to generate random tracking instructions to capture the execution plan of the statements executed on the database server.
Follow these steps to open SQL Server 2005 Profiler.
1. Select SQL Server Profiler from the Tools menu on SQL Server Management Studio. SQL Profiler will be opened with a blank screen.
2. In the File menu, select New Trace and connect to the server you want to monitor.
3. At the Trace Properties screen, select the Events Selection tab to select the events you want to monitor. At the bottom right of the window, select the Show All Events check box. This option will expand all available events to follow.
4. Navigate to Performance section and select Showplan XML event. This event captures diagrams implemented in an XML format that you can graphically view in SQL Profiler or SQL Server Management Studio. See Figure A.

Picture A
What is important is what you are following. If too much information is tracked, it is likely to cause a slow server database operation; Instead, keep track of the information you need and not too much.
Once you select the Showplan XML event, you will see that the Performance title is the Events Extraction Setting tab. This tag offers two options for saving XML data from Profiler tracking. The first option allows you to save the execution plan generated from tracking one or more XML documents. This option is good because it stores executable diagrams in a .sqlplan file that you can open with SQL Server Management Studio to view. This option allows you to view all execution plans at the same time. See Figure B and Figure C.

Figure B

Figure C
Eliminate all events related to login information or existing connections. RPC: Events completed in each step perform a procedure to call the remote database. This will track the first stored procedure from any application that finds the database.
You should make sure that you will not track any unnecessary data. You should remove the stored procedure sp_reset_connection because it is called by the database tool for group connection purposes. To do this, click the Column Filters button in the Trace Properties window as shown in Figure D. This Edit Filter window displays the columns you have selected and can continue filtering. ObjectName columns are not selected, so you will only filter on TextData columns. Then enter the stored procedure in the Not Like section. This will prevent calling the database into the tracking table. You can also use some other filters like: LoginName filter (If you want to see the database activity of a certain user), either the Duration and Reads columns (if you are looking for solid queries special). After selecting the filter, you can start the tracking process.
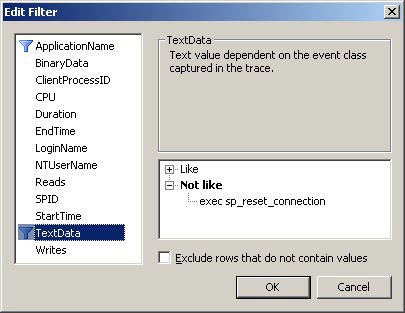
Figure D
Figure E is a list of activities on the server. Some server databases have been set up for transaction copies to explain calling some copy system procedures. The following example highlights one of the Showplan XML events that gives the same visual execution diagrams if they are implemented in Management Studio. This is an incredible tool to instantly point out potential problems with queries.
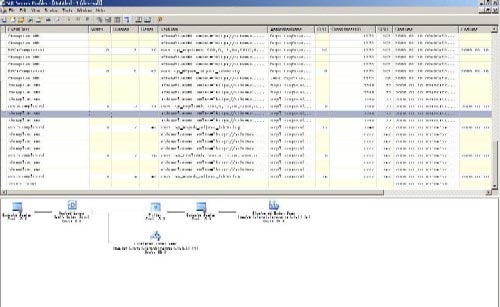
Figure E
Figure F shows the result. The SQLPlan file is created from the track you just made. SQL Server Management Studio recognizes these types of files, so you can open the file to see all the execution plans captured by SQL tracking, which is very convenient for adjusting purposes.
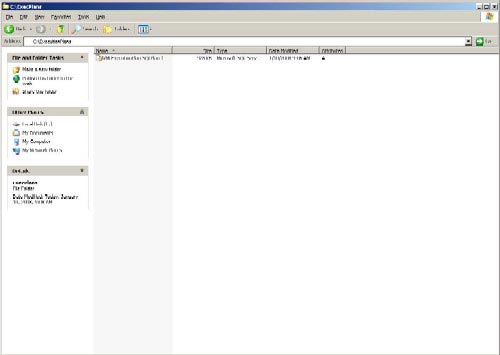
Figure F