Working with Network Monitor (Part 5)
In the previous article of this series, we demonstrated that even capturing a simple network will give a lot of result packages that you don't really need. And also showed you how to filter out 'junk' packages to see only the
 Working with Network Monitor (Part 1)
 Working with Network Monitor (Part 2)
 Working with Network Monitor (Part 3)
 Working with Network Monitor (Part 4)
Brien M. Posey
In the previous article of this series, we demonstrated that even capturing a simple network will give a lot of result packages that you don't really need. And also showed you how to filter out 'junk' packages to see only the packages that you really care about. Now we want to continue to show you how to analyze the rest of the packages so that you can see what they include.
In the previous section of the previous section, the captured and filtered set of packages is similar to the one shown in Figure A. As explained in the first part of this article, I captured the data shown in the figure. by starting the capture, then executing the PING command and finally stopping the capture. My goal is to simplify things if possible. If you look at Figure A, you can see where the ICMP packets have been broadcast and where the replies have been received.

Figure 1: Really useful when filtering out unimportant packages
If this is a real life capture, there is no need to delve into the data because you can tell exactly what is going on by observing the Description column. But in the real world, things aren't that simple. To determine exactly what is going on inside a trace, it is necessary to look inside specific data packets.
There is nothing special to introduce to you in the ICMP package. In this case, let's look at some of the captured LDAP packets. You probably already know, LDAP stands for Light Weight Directory Access Protocol. LDAP is the protocol used to read information from Active Directory and also write information to Active Directory.
There are two reasons we want to show you how to analyze an LDAP package. First, in real world traces to the Windows network, LDAP packets are a very general case. The existence of LDAP packages in such a common way that you will need to decipher their meaning. The second reason is to understand what package is working. The technologies we want to show you can be used to look at the content within packages, which means that not every package will mean anything unless you are an expert on protocol.
Consider inside a package
Let's start by looking inside the box 284. The description simply says that this frame is a search request. However, in fact, it shows that a machine emitting this LDAP search request doesn't really give you that much. One way to know what this search request includes is to look inside the package.
Before opening the package, click on the icons to change the details panel and the hex panel. When all three panels are displayed, select the package you want to consider. When you are done selecting the package, you will see a screen similar to the one shown in Figure B.
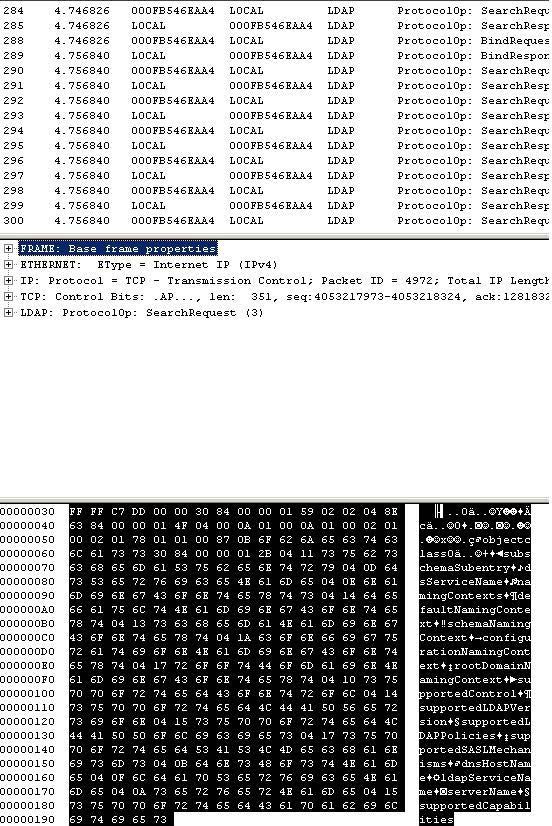
Figure B: Content inside a package
The first thing to consider is the details panel. If you look at this panel you will see that there are a number of different items that are scalable (Frame, Ethernet, IP, TCP and LDAP). The reason for the different entries here is because the packages are typically primitive. The package that we are considering is an LDAP package, but computers do not mention primitive LDAP. LDAP is based on TCP protocol. TCP is a small part of the IP protocol. Each item in the details pane shows a separate summary class.
If you look at the hex panel, you will see the contents of the packages shown as hexa. Note that each byte is marked with black. The reason for this markup is because the bytes highlighted in black correspond to the part of the selected package in the details pane. In this particular case, the FRAME item is selected. This section shows the entire frame, which explains why the entire frame is blacked out. If we select the LDAP entry, only the bytes corresponding to the LDAP data will be blacked out as shown in Figure C.
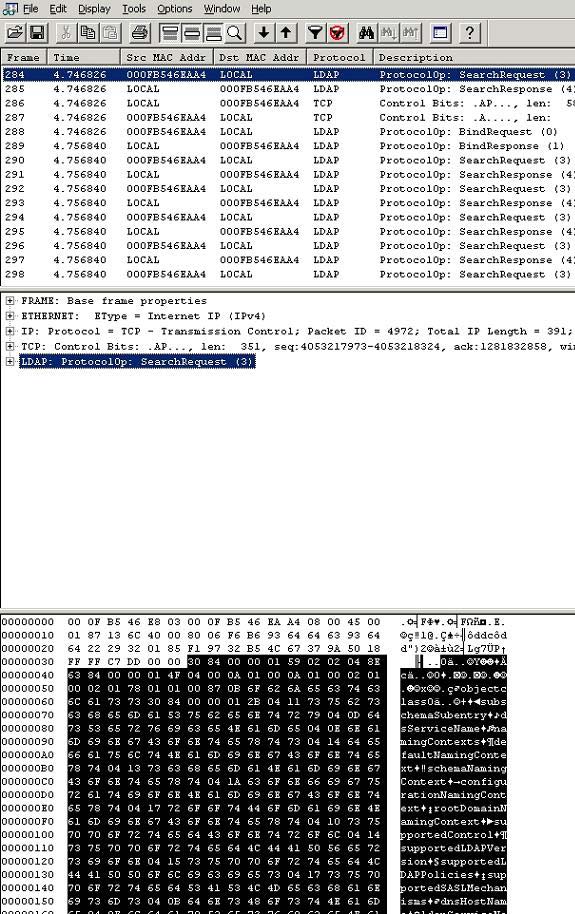
Figure C: Panel hex blackens the currently selected part of the package
You can see that each of these packages is expandable. By clicking on the plus sign next to each item, it can log content inside the package. Usually we can completely see the exact package by looking inside the frame. If you look closely at Figure C, you can pick up some words that can be read inside the content. However, this readable data is actually very difficult to read in practice. Words start on this line and end on the next line and are often divided by confusing symbols. Blackening also makes this part more difficult to read. A better way to see the contents of this package is to extend the LDAP portion of the package from within the details pane. Expanding the LDAP panel will show you that this particular package is an LDAP search request as shown in Figure D. This means that the package has been sent trying to query Active Directory.
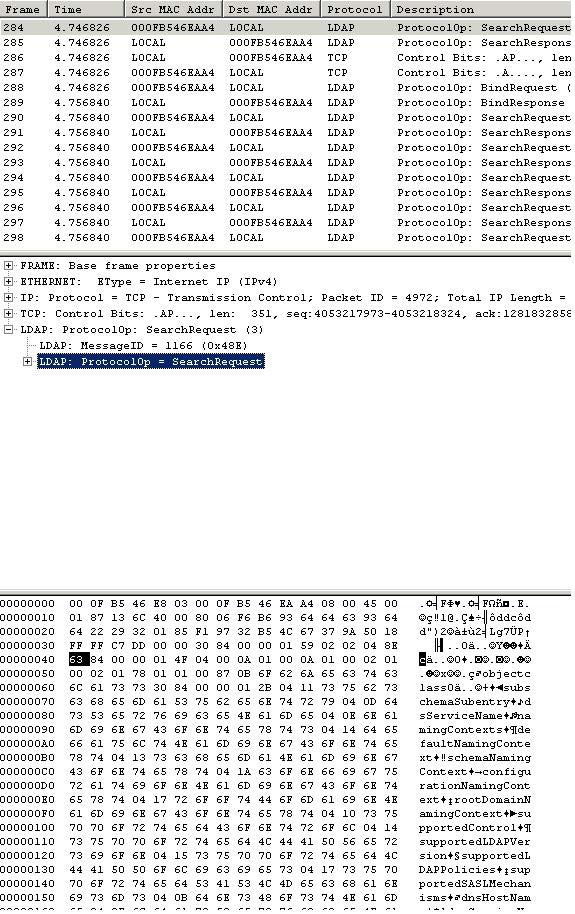
Figure D: Opening the LDAP section we will see this is the LDAP search request package
So now we know what the purpose of this package is, but we still don't know what this package is actually doing. An LDAP request is required to query information from Active Directory, but what information does it want to query? If you open the LDAP section: Protocol0p = SearchRequest, you can see that one of the sub-items labeled Attribute Description List is shown in Figure E. If you look at this image, you will see that Attribute Description List corresponds to Clearer data section is displayed in hex frame.
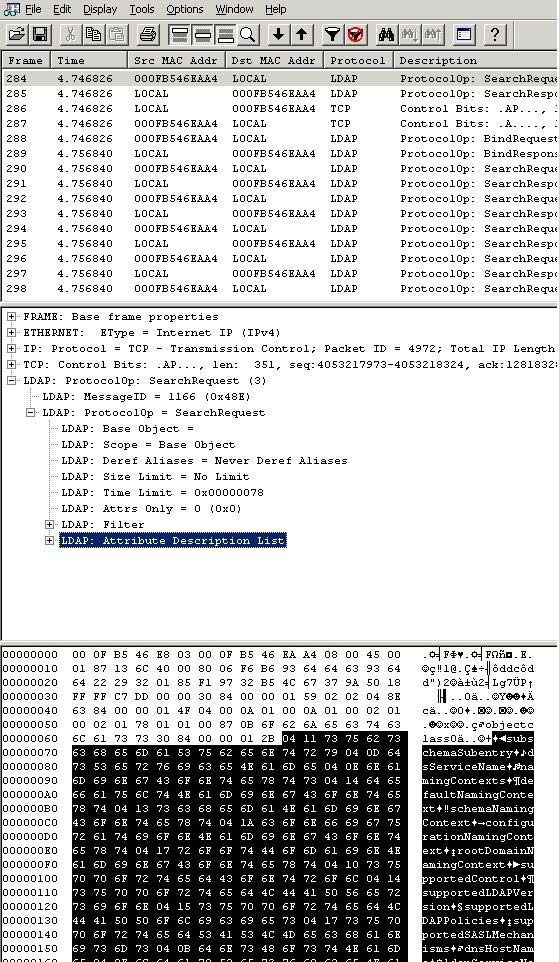
Figure E: LDAP search requests are always padded with an attribute description list.
You will also see in this figure, the list item describing properties is fully expandable. If you open this section, you can see that Network Monitor correctly displays which LDAP attributes the frame is requesting data as shown in Figure F.
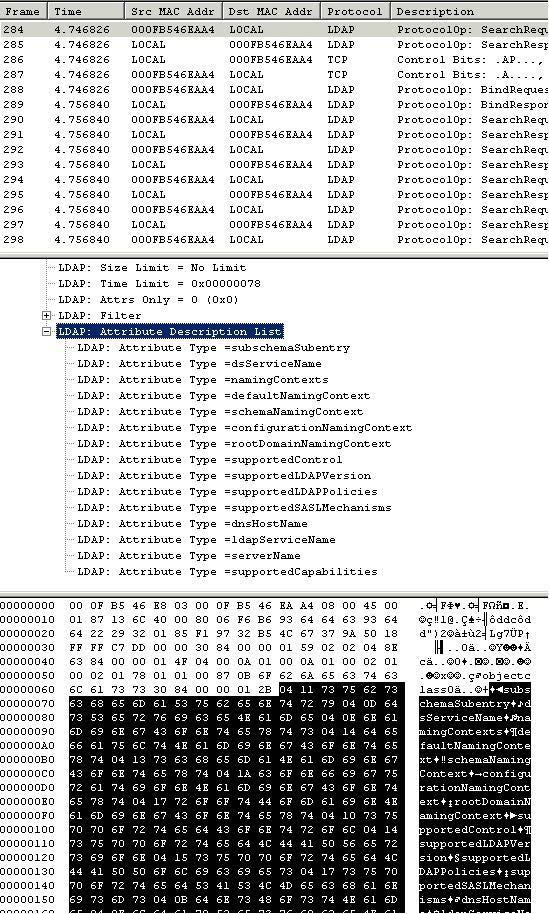
Figure F: Network Monitor displays a list of properties for the component
where the LDAP query is trying to query the data.
Conclude
So, through this series, I have basically introduced how to use Network Monitor. Microsoft will soon release version 3 of Network Monitor, but everything that I have introduced to you in this article will still work well until the new version is released.


 5 quick commands to fix broken packages in Linux
  Why do so many people still subscribe to YouTube Premium despite the price increase?
  Hurry up and buy data packages on My Viettel to receive great deals from Grab
  Everything you need to know about the DNF package manager
  Instructions for changing application subscription packages on the App Store
  Users can only use a maximum of about 40% of the package's network speed