Today's article will rank all previous and current generation graphics cards by performance, including all the best graphics cards, according to data from Tom's Hardware. The GPU testing process has been improved and all benchmarks updated for 2024 for current generation AMD RDNA 2 and Nvidia Ampere GPUs, Turing and RDNA series, as well as many other generations.
The following tables only sort things by performance-based GPU gaming benchmarks, excluding price, graphics card power consumption, overall performance, and other features.
GPU Benchmark Ranking 2022
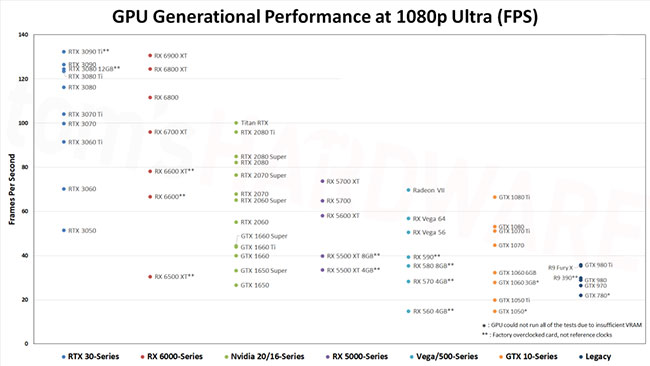
| Graphics card | 1080p Ultra | 1080p Medium | 1440p Ultra | 4K Ultra |
|---|---|---|---|---|
| GeForce RTX 3090 Ti GA102, 10752 shaders, 1860MHz, 24GB GDDR6X@21Gbps, 1008GB/s, 450W | 100.0% (132.4fps) | 100.0% (180.1fps) | 100.0% (113.9fps) | 100.0% (75.7fps) |
| Radeon RX 6900 XT Navi 21, 5120 shaders, 2250MHz, 16GB GDDR6@16Gbps, 512GB/s, 300W | 98.6% (130.6fps) | 103.4% (186.2fps) | 94.0% (107.0fps) | 83.1% (62.9fps) |
| GeForce RTX 3090 GA102, 10496 shaders, 1695MHz, 24GB GDDR6X@19.5Gbps, 936GB/s, 350W | 95.6% (126.6fps) | 98.9% (178.1fps) | 93.6% (106.5fps) | 90.9% (68.8fps) |
| GeForce RTX 3080 12GB GA102, 8960 shaders, 1845MHz, 12GB GDDR6X@19Gbps, 912GB/s, 400W | 94.0% (124.5fps) | 99.0% (178.2fps) | 91.3% (104.0fps) | 87.6% (66.3fps) |
| Radeon RX 6800 XT Navi 21, 4608 shaders, 2250MHz, 16GB GDDR6@16Gbps, 512GB/s, 300W | 94.0% (124.5fps) | 100.3% (180.7fps) | 88.9% (101.2fps) | 77.3% (58.5fps) |
| GeForce RTX 3080 Ti GA102, 10240 shaders, 1665MHz, 12GB GDDR6X@19Gbps, 912GB/s, 350W | 93.2% (123.4fps) | 97.1% (174.9fps) | 90.8% (103.4fps) | 87.8% (66.5fps) |
| GeForce RTX 3080 GA102, 8704 shaders, 1710MHz, 10GB GDDR6X@19Gbps, 760GB/s, 320W | 87.8% (116.3fps) | 96.3% (173.4fps) | 83.9% (95.5fps) | 80.1% (60.6fps) |
| Radeon RX 6800 Navi 21, 3840 shaders, 2105MHz, 16GB GDDR6@16Gbps, 512GB/s, 250W | 84.3% (111.7fps) | 96.8% (174.3fps) | 76.9% (87.5fps) | 66.7% (50.5fps) |
| GeForce RTX 3070 Ti GA104, 6144 shaders, 1770MHz, 8GB GDDR6X@19Gbps, 608GB/s, 290W | 78.6% (104.1fps) | 90.2% (162.4fps) | 72.5% (82.6fps) | 61.9% (46.8fps) |
| Titan RTX TU102, 4608 shaders, 1770MHz, 24GB GDDR6@14Gbps, 672GB/s, 280W | 75.6% (100.1fps) | 87.9% (158.2fps) | 70.7% (80.5fps) | 63.8% (48.3fps) |
| GeForce RTX 3070 GA104, 5888 shaders, 1725MHz, 8GB GDDR6@14Gbps, 448GB/s, 220W | 75.3% (99.8fps) | 87.5% (157.7fps) | 68.0% (77.5fps) | 57.0% (43.2fps) |
| Radeon RX 6700 XT Navi 22, 2560 shaders, 2581MHz, 12GB GDDR6@16Gbps, 384GB/s, 230W | 72.5% (96.0fps) | 88.7% (159.8fps) | 61.9% (70.4fps) | 50.9% (38.5fps) |
| GeForce RTX 2080 Ti TU102, 4352 shaders, 1545MHz, 11GB GDDR6@14Gbps, 616GB/s, 250W | 72.5% (96.0fps) | 84.2% (151.6fps) | 66.1% (75.3fps) | 58.9% (44.6fps) |
| GeForce RTX 3060 Ti GA104, 4864 shaders, 1665MHz, 8GB GDDR6@14Gbps, 448GB/s, 200W | 69.1% (91.5fps) | 83.1% (149.7fps) | 61.2% (69.7fps) | |
| GeForce RTX 2080 Super TU104, 3072 shaders, 1815MHz, 8GB GDDR6@15.5Gbps, 496GB/s, 250W | 64.1% (84.9fps) | 76.5% (137.8fps) | 57.0% (64.9fps) | 45.6% (34.5fps) |
| GeForce RTX 2080 TU104, 2944 shaders, 1710MHz, 8GB GDDR6@14Gbps, 448GB/s, 215W | 62.1% (82.2fps) | 73.9% (133.1fps) | 54.8% (62.4fps) | |
| Radeon RX 6600 XT Navi 23, 2048 shaders, 2589MHz, 8GB GDDR6@16Gbps, 256GB/s, 160W | 59.1% (78.2fps) | 76.0% (136.8fps) | 48.2% (54.9fps) | |
| GeForce RTX 2070 Super TU104, 2560 shaders, 1770MHz, 8GB GDDR6@14Gbps, 448GB/s, 215W | 57.7% (76.4fps) | 68.9% (124.1fps) | 50.4% (57.4fps) | |
| Radeon RX 5700 XT Navi 10, 2560 shaders, 1905MHz, 8GB GDDR6@14Gbps, 448GB/s, 225W | 55.7% (73.7fps) | 69.9% (125.8fps) | 46.8% (53.3fps) | 38.6% (29.3fps) |
| GeForce RTX 3060 GA106, 3584 shaders, 1777MHz, 12GB GDDR6@15Gbps, 360GB/s, 170W | 53.0% (70.2fps) | 66.0% (118.8fps) | 46.2% (52.6fps) | |
| Radeon VII Vega 20, 3840 shaders, 1750MHz, 16GB HBM2@2.0Gbps, 1024GB/s, 300W | 52.6% (69.7fps) | 63.3% (114.0fps) | 46.5% (53.0fps) | 41.5% (31.4fps) |
| GeForce RTX 2070 TU106, 2304 shaders, 1620MHz, 8GB GDDR6@14Gbps, 448GB/s, 175W | 51.3% (67.9fps) | 61.5% (110.7fps) | 44.8% (51.0fps) | |
| Radeon RX 6600 Navi 23, 1792 shaders, 2491MHz, 8GB GDDR6@14Gbps, 224GB/s, 132W | 50.4% (66.7fps) | 65.4% (117.8fps) | 40.5% (46.1fps) | |
| GeForce GTX 1080 Ti GP102, 3584 shaders, 1582MHz, 11GB GDDR5X@11Gbps, 484GB/s, 250W | 50.3% (66.5fps) | 61.4% (110.6fps) | 44.1% (50.3fps) | 39.0% (29.5fps) |
| GeForce RTX 2060 Super TU106, 2176 shaders, 1650MHz, 8GB GDDR6@14Gbps, 448GB/s, 175W | 49.1% (65.1fps) | 58.8% (105.9fps) | 42.4% (48.2fps) | |
| Radeon RX 5700 Navi 10, 2304 shaders, 1725MHz, 8GB GDDR6@14Gbps, 448GB/s, 180W | 49.0% (64.8fps) | 61.8% (111.3fps) | 41.4% (47.2fps) | |
| Radeon RX 5600 XT Navi 10, 2304 shaders, 1750MHz, 8GB GDDR6@14Gbps, 336GB/s, 160W | 43.9% (58.1fps) | 55.8% (100.6fps) | 36.9% (42.0fps) | |
| Radeon RX Vega 64 Vega 10, 4096 shaders, 1546MHz, 8GB HBM2@1.89Gbps, 484GB/s, 295W | 42.9% (56.8fps) | 52.4% (94.3fps) | 36.5% (41.6fps) | 31.0% (23.5fps) |
| GeForce RTX 2060 TU106, 1920 shaders, 1680MHz, 6GB GDDR6@14Gbps, 336GB/s, 160W | 41.7% (55.2fps) | 53.8% (96.8fps) | 34.0% (38.7fps) | |
| GeForce GTX 1080 GP104, 2560 shaders, 1733MHz, 8GB GDDR5X@10Gbps, 320GB/s, 180W | 40.1% (53.1fps) | 50.0% (90.0fps) | 34.6% (39.4fps) | |
| GeForce RTX 3050 GA106, 2560 shaders, 1777MHz, 8GB GDDR6@14Gbps, 224GB/s, 130W | 38.8% (51.4fps) | 49.6% (89.4fps) | 33.0% (37.6fps) | |
| GeForce GTX 1070 Ti GP104, 2432 shaders, 1683MHz, 8GB GDDR5@8Gbps, 256GB/s, 180W | 38.6% (51.1fps) | 47.6% (85.8fps) | 33.3% (37.9fps) | |
| Radeon RX Vega 56 Vega 10, 3584 shaders, 1471MHz, 8GB HBM2@1.6Gbps, 410GB/s, 210W | 38.2% (50.6fps) | 46.9% (84.4fps) | 32.5% (37.0fps) | |
| GeForce GTX 1070 GP104, 1920 shader, 1683MHz, 8GB GDDR5@8Gbps, 256GB/s, 150W | 33.8% (44.8fps) | 35.5% (64.0fps) | 34.1% (38.8fps) | |
| GeForce GTX 1660 Super TU116, 1408 shader, 1785MHz, 6GB GDDR6@14Gbps, 336GB/s, 125W | 33.6% (44.4fps) | 46.0% (82.8fps) | 27.6% (31.5fps) | |
| GeForce GTX 1660 Ti TU116, 1536 shader, 1770MHz, 6GB GDDR6@12Gbps, 288GB/s, 120W | 33.1% (43.9fps) | 45.4% (81.9fps) | 27.7% (31.6fps) | |
| GeForce GTX 1660 TU116, 1408 shader, 1785MHz, 6GB GDDR5@8Gbps, 192GB/s, 120W | 30.1% (39.9fps) | 41.7% (75.1fps) | 25.0% (28.5fps) | |
| Radeon RX 5500 XT 8GB Navi 14, 1408 shader, 1845MHz, 8GB GDDR6@14Gbps, 224GB/s, 130W | 30.1% (39.8fps) | 40.3% (72.6fps) | 25.0% (28.5fps) | |
| Radeon RX 590 Polaris 30, 2304 shader, 1545MHz, 8GB GDDR5@8Gbps, 256GB/s, 225W | 29.7% (39.4fps) | 38.1% (68.6fps) | 25.5% (29.1fps) | |
| GeForce GTX 980 Ti GM200, 2816 shader, 1075MHz, 6GB GDDR5@7Gbps, 336GB/s, 250W | 27.1% (35.9fps) | 34.7% (62.6fps) | 23.4% (26.7fps) | |
| Radeon R9 Fury X Fiji, 4096 shader, 1050MHz, 4GB HBM2@2Gbps, 512GB/s, 275W | 26.7% (35.4fps) | 35.8% (64.4fps) | ||
| Radeon RX 580 8GB Polaris 20, 2304 shader, 1340MHz, 8GB GDDR5@8Gbps, 256GB/s, 185W | 26.7% (35.3fps) | 34.3% (61.7fps) | 22.8% (26.0fps) | |
| Radeon RX 5500 XT 4GB Navi 14, 1408 shader, 1845MHz, 4GB GDDR6@14Gbps, 224GB/s, 130W | 25.3% (33.5fps) | 37.2% (66.9fps) | ||
| GeForce GTX 1650 Super TU116, 1280 shader, 1725MHz, 4GB GDDR6@12Gbps, 192GB/s, 100W | 25.1% (33.2fps) | 37.7% (67.9fps) | 20.2% (23.0fps) | |
| GeForce GTX 1060 6GB GP106, 1280 shader, 1708MHz, 6GB GDDR5@8Gbps, 192GB/s, 120W | 24.3% (32.2fps) | 32.2% (58.0fps) | 20.2% (23.0fps) | |
| Radeon RX 6500 XT Navi 24, 1024 shader, 2815MHz, 4GB GDDR6@18Gbps, 144GB/s, 107W | 23.0% (30.4fps) | 36.3% (65.4fps) | 15.8% (18.0fps) | |
| Radeon R9 390 Grenada, 2560 shader, 1000MHz, 8GB GDDR5@6Gbps, 384GB/s, 275W | 22.5% (29.8fps) | 28.4% (51.2fps) | ||
| GeForce GTX 980 GM204, 2048 shader, 1216MHz, 4GB GDDR5@7Gbps, 256GB/s, 165W | 21.8% (28.9fps) | 29.8% (53.7fps) | ||
| Radeon RX 570 4GB Polaris 20, 2048 shader, 1244MHz, 4GB GDDR5@7Gbps, 224GB/s, 150W | 21.4% (28.3fps) | 29.8% (53.6fps) | 17.5% (20.0fps) | |
| GeForce GTX 1060 3GB * GP106, 1152 shader, 1708MHz, 3GB GDDR5@8Gbps, 192GB/s, 120W | 21.0% (27.8fps) | 29.2% (52.6fps) | ||
| GeForce GTX 1650 TU117, 896 shader, 1665MHz, 4GB GDDR5@8Gbps, 128GB/s, 75W | 20.1% (26.6fps) | 28.4% (51.1fps) | ||
| GeForce GTX 970 GM204, 1664 shader, 1178MHz, 4GB GDDR5@7Gbps, 256GB/s, 145W | 20.0% (26.5fps) | 27.3% (49.1fps) | ||
| GeForce GTX 780 * GK110, 2304 shader, 900MHz, 3GB GDDR5@6Gbps, 288GB/s, 230W | 16.6% (22.0fps) | 21.4% (38.5fps) | ||
| GeForce GTX 1050 Ti GP107, 768 shader, 1392MHz, 4GB GDDR5@7Gbps, 112GB/s, 75W | 15.0% (19.8fps) | 21.1% (38.0fps) | ||
| GeForce GTX 1050 * GP107, 640 shader, 1455MHz, 2GB GDDR5@7Gbps, 112GB/s, 75W | 11.2% (14.8fps) | 16.5% (29.8fps) | ||
| Radeon RX 560 4GB Baffin, 1024 shader, 1275MHz, 4GB GDDR5@7Gbps, 112GB/s, 60-80W | 11.2% (14.8fps) | 17.7% (31.8fps) | ||
| Radeon RX 550 4GB Lexa, 640 shader, 1183MHz, 4GB GDDR5@7Gbps, 112GB/s, 50W | Not tested | 10.9% (19.6fps) |
2022 GPU Ray Tracing Performance Benchmark Rankings
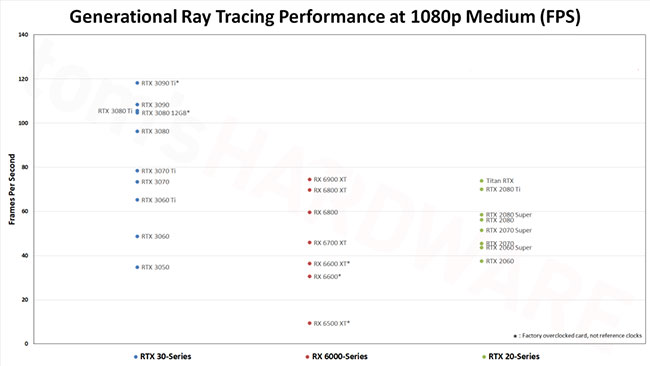
| Graphics card | 1080p Medium | 1080p Ultra | 1440p Ultra | 4K Ultra |
|---|---|---|---|---|
| GeForce RTX 3090 Ti GA102, 10752 shader, 1860MHz, 24GB GDDR6X@21Gbps, 1008GB/s, 450W | 100.0% (118.2fps) | 100.0% (84.4fps) | 100.0% (57.2fps) | 100.0% (29.1fps) |
| GeForce RTX 3090 GA102, 10496 shader, 1695MHz, 24GB GDDR6X@19.5Gbps, 936GB/s, 350W | 91.7% (108.4fps) | 89.7% (75.7fps) | 88.7% (50.8fps) | 87.2% (25.4fps) |
| GeForce RTX 3080 Ti GA102, 10240 shader, 1665MHz, 12GB GDDR6X@19Gbps, 912GB/s, 350W | 89.3% (105.6fps) | 87.6% (73.9fps) | 86.0% (49.2fps) | 84.6% (24.7fps) |
| GeForce RTX 3080 12GB GA102, 8960 shader, 1845MHz, 12GB GDDR6X@19Gbps, 912GB/s, 400W | 88.5% (104.7fps) | 85.8% (72.4fps) | 83.7% (47.9fps) | 81.4% (23.7fps) |
| GeForce RTX 3080 GA102, 8704 shader, 1710MHz, 10GB GDDR6X@19Gbps, 760GB/s, 320W | 81.5% (96.3fps) | 78.5% (66.3fps) | 76.3% (43.7fps) | 72.2% (21.0fps) |
| GeForce RTX 3070 Ti GA104, 6144 shader, 1770MHz, 8GB GDDR6X@19Gbps, 608GB/s, 290W | 66.3% (78.4fps) | 63.0% (53.1fps) | 59.2% (33.9fps) | |
| Radeon RX 6900 XT Navi 21, 5120 shader, 2250MHz, 16GB GDDR6@16Gbps, 512GB/s, 300W | 63.0% (74.5fps) | 59.0% (49.8fps) | 55.2% (31.6fps) | 51.7% (15.1fps) |
| Titan RTX TU102, 4608 shader, 1770MHz, 24GB GDDR6@14Gbps, 672GB/s, 280W | 62.5% (73.9fps) | 58.2% (49.1fps) | 55.4% (31.7fps) | 52.5% (15.3fps) |
| GeForce RTX 3070 GA104, 5888 shader, 1725MHz, 8GB GDDR6@14Gbps, 448GB/s, 220W | 62.1% (73.4fps) | 58.7% (49.6fps) | 54.9% (31.4fps) | |
| GeForce RTX 2080 Ti TU102, 4352 shader, 1545MHz, 11GB GDDR6@14Gbps, 616GB/s, 250W | 59.2% (70.0fps) | 55.1% (46.5fps) | 52.0% (29.7fps) | |
| Radeon RX 6800 XT Navi 21, 4608 shader, 2250MHz, 16GB GDDR6@16Gbps, 512GB/s, 300W | 59.0% (69.7fps) | 54.6% (46.1fps) | 51.3% (29.4fps) | 48.2% (14.0fps) |
| GeForce RTX 3060 Ti GA104, 4864 shader, 1665MHz, 8GB GDDR6@14Gbps, 448GB/s, 200W | 55.2% (65.3fps) | 51.3% (43.3fps) | 47.8% (27.4fps) | |
| Radeon RX 6800 Navi 21, 3840 shader, 2105MHz, 16GB GDDR6@16Gbps, 512GB/s, 250W | 50.4% (59.6fps) | 46.6% (39.3fps) | 43.6% (24.9fps) | |
| GeForce RTX 2080 Super TU104, 3072 shader, 1815MHz, 8GB GDDR6@15.5Gbps, 496GB/s, 250W | 49.6% (58.6fps) | 45.0% (37.9fps) | 41.6% (23.8fps) | |
| GeForce RTX 2080 TU104, 2944 shader, 1710MHz, 8GB GDDR6@14Gbps, 448GB/s, 215W | 47.5% (56.2fps) | 42.5% (35.9fps) | 39.1% (22.4fps) | |
| GeForce RTX 2070 Super TU104, 2560 shader, 1770MHz, 8GB GDDR6@14Gbps, 448GB/s, 215W | 43.6% (51.5fps) | 39.2% (33.1fps) | 35.5% (20.3fps) | |
| GeForce RTX 3060 GA106, 3584 shader, 1777MHz, 12GB GDDR6@15Gbps, 360GB/s, 170W | 41.2% (48.7fps) | 38.3% (32.3fps) | 35.1% (20.1fps) | |
| Radeon RX 6700 XT Navi 22, 2560 shader, 2581MHz, 12GB GDDR6@16Gbps, 384GB/s, 230W | 38.8% (45.9fps) | 36.1% (30.5fps) | 32.6% (18.7fps) | |
| GeForce RTX 2070 TU106, 2304 shader, 1620MHz, 8GB GDDR6@14Gbps, 448GB/s, 175W | 38.5% (45.5fps) | 34.9% (29.4fps) | 31.6% (18.1fps) | |
| GeForce RTX 2060 Super TU106, 2176 shader, 1650MHz, 8GB GDDR6@14Gbps, 448GB/s, 175W | 36.9% (43.6fps) | 33.0% (27.9fps) | 29.9% (17.1fps) | |
| GeForce RTX 2060 TU106, 1920 shader, 1680MHz, 6GB GDDR6@14Gbps, 336GB/s, 160W | 31.8% (37.6fps) | 26.7% (22.5fps) | ||
| Radeon RX 6600 XT Navi 23, 2048 shader, 2589MHz, 8GB GDDR6@16Gbps, 256GB/s, 160W | 30.8% (36.4fps) | 28.0% (23.6fps) | ||
| GeForce RTX 3050 GA106, 2560 shader, 1777MHz, 8GB GDDR6@14Gbps, 224GB/s, 130W | 29.4% (34.8fps) | 27.0% (22.8fps) | ||
| Radeon RX 6600 Navi 23, 1792 shader, 2491MHz, 8GB GDDR6@14Gbps, 224GB/s, 132W | 25.8% (30.5fps) | 23.3% (19.6fps) | ||
| Radeon RX 6500 XT Navi 24, 1024 shader, 2815MHz, 4GB GDDR6@18Gbps, 144GB/s, 107W | 7.9% (9.4fps) |
The 2022 test system used an Alder Lake platform and processor. The following section lists the full hardware configuration.
- Intel Core i9-12900K
- MSI Pro Z690-A WiFi DDR4
- Corsair 2x16GB DDR4-3600 CL16
- Crucial P5 Plus 2TB
- Cooler Master MWE 1250 V2 Gold
- Cooler Master PL360 Flux
- Cooler Master HAF500
- Windows 11 Pro 64-bit






Reader Comments 0
Sign in with email or Google to join the discussion.