Overview of the TMG Firewall Troubleshooting feature
One of the most recognizable enhancements in the TMG firewall is what is available in the ISA 2006 firewall, which is the Troubleshooting section..
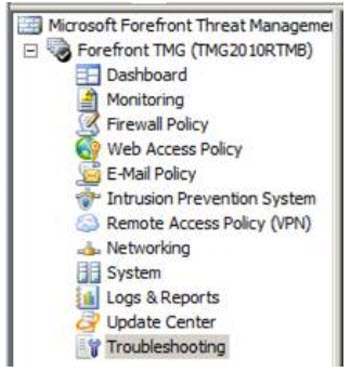
TipsMake.com - One of the most recognizable enhancements in the TMG firewall is what is available in the ISA 2006 firewall, which is Troubleshooting - in the left pane of the TMG firewall control panel . In fact, the tools that come with the TMG firewall proved to be really effective in troubleshooting some of the problems that often occur with the TMG firewall itself.
About the Troubleshooting card
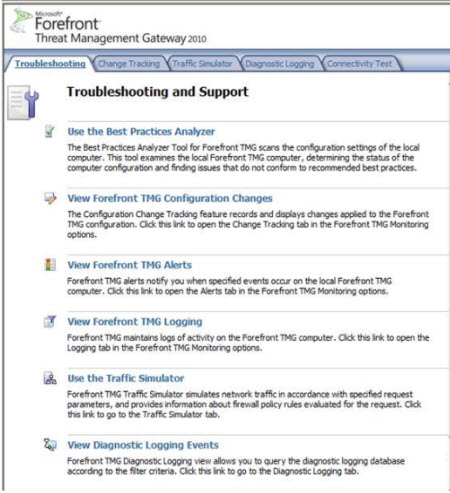
When you select the Troubleshooting tab, you will see the following components:
- Use the Best Practices Analyzer: when selecting this option, the TMG Best Practices Analyzer feature will start. The author recommends that all TMG firewall administrators regularly use TMG BPA. This function is designed to find out the most common problems of TMG firewall, and save you a lot of time when you want to find the best security solution for the system.
- View Forefront TMG Configuration Changes: if you select this option, you will be redirected to Change Tracking tab - here, you will find information about the changes that have been applied to setting up the firewall system through the stage.
- View Forefront TMG Alerts: This path will continue to open the Alerts tab in the TMG firewall control panel, through which you can view alerts generated by the firewall system.
View Forefront TMG Logging: similar to the above, this is where the TMG firewall log data is stored, the manager can perform advanced query statements to the TMG firewall log system, while reducing the Connection problems through the TMG firewall.
- Use the Traffic Simulator: when selecting this link, the manager will be directed to the Traffic Simulator tab, where you can simulate some common network traffic types. This can help managers identify basic principles or problems that often occur with connection problems.
- View Diagnostic Logging Events: Similar to the above tags, when you select this link, you will switch to work at Diagnostic Logging tab, this is the place to execute special query statements to diagnose possible events. happens when enabling storage and analysis features in the TMG firewall.
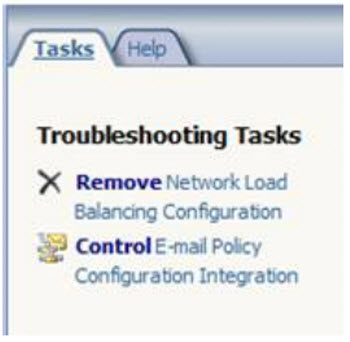
- Remove Network Load Balancing Configuration: when selecting this function, the application will automatically remove all NLB settings from the TMG firewall 'arrays'. This function is quite useful, because this is a part of the implementation phase of the test code, it is often difficult to locate. In addition, you must determine the existence or appearance of these code snippets in the first place. This can also be considered as an 'integrated' form of superior functions that make the TMG firewall safer than comparable products.
- Configure E-mail Policy Configuration Integration: the option is enabled by default, allowing the TMG firewall control panel to be the main interface for adjusting, setting up Exchange Edge and Forefront for Exchange. But when this feature is turned off, the administrator will have to adjust the settings outside of the TMG firewall.
Change Tracking tab
With Change Tracking tab, users can see the changed components. These components describe the changing events that take place in the TMG firewall through the stages. But while many people are thinking that this is a good way to manage changing events, research TMG firewall recommends that users limit their use of this function, because the information stored in This is not protected - this means that, when bad guys can access and interfere with all the data here, it will seriously affect the safety and reliability of the entire system.
Looking at the picture below, it is easy to recognize some of the changes that have been applied:
- Changes in information of day, month, hour .
- User account
- Details of changes
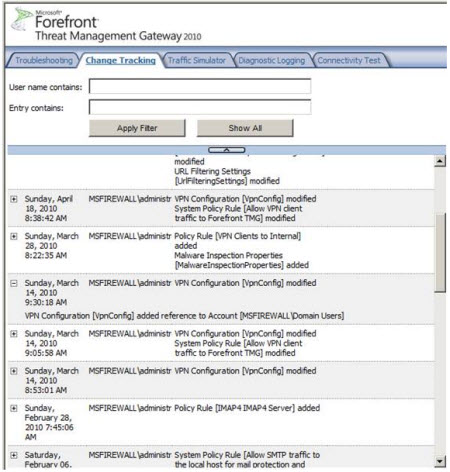
- User name contains: use this function if you want to filter all components according to the user account that created the change.
- Entry contains: use this feature if you need to filter all information by string, in addition, you can identify adjustments, settings . or other components.
- Apply Filter: select this button to apply all changes the user has just created.
- Show All: press this button to display all components after applying the filter.
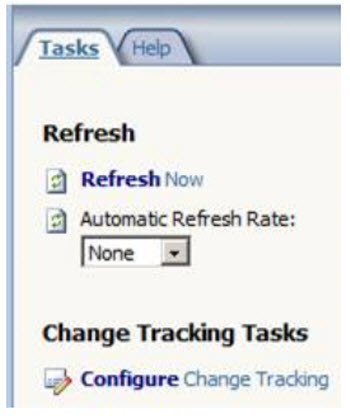
In the right pane of the control panel, you can see the Configure Change Tracking option:
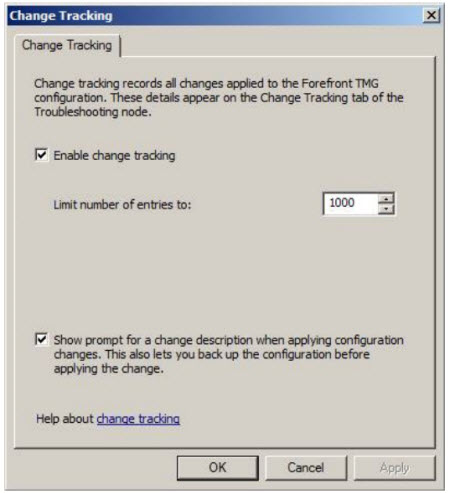
In the Change Tracking table, the user has two main choices:
- Enable change tracking: this feature is enabled in the default mode, if you want to turn it off, just uncheck the checkbox. When enabled, you can control, control the total number of components you want to monitor, the default value is 1000. But be careful with the components when you increase the number, which will affect directly to the operating speed of the entire system. The default value of 1000 above is the best balance between control data and system performance.
- Show prompt for a xác định thay đổi khi dùng các thay đổi cấu hình. This lets you backup the configuration before applying the change: this option is also enabled by default, when the user remembers the changes applied on the firewall system, a dialog box will appear, prompting Remind users to annotate changes. Besides, this feature also prompts if users want to back up these settings before applying them to the firewall's operating policies:
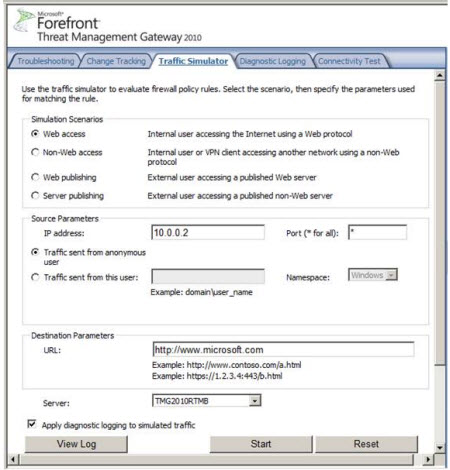
Traffic Simulator card:
At the Traffic Simulator tab, users will have a certain number of options to check connections, and whether policies apply to the rules available on the TMG firewall system. . This function is very useful in diagnosing, identifying problems with firewalls, or finding out which rules and rules create connections that do not allow users to bypass firewall systems, or problems. other.
- Web access: select this item if you want to collect all issues with web access.
- Non-Web access: select this option if you need to collect all the phenomena, problems with non-HTTP / HTTPS connections.
- Web publishing: similar to the above, select this option if you want to update issues with the public website rules.
- Server publishing: the image is similar to that of Web Publishing.
Depending on the situation, the Source Parameters option will change. In this example, we will select the Web access section. Then with Source Parameters option, we will enter the source IP address of the host in the internal network, besides, we remove the Port setting value of *, adjust the test parameters to traffic the traffic data. sent from any user account.
In the Destination Parameters section, we enter the value of the URL to check (here select http://www.microsoft.com/ ), the Server is the TMG firewall system that we are operating, and also tick cell Apply diagnostic logging to simulated traffic:
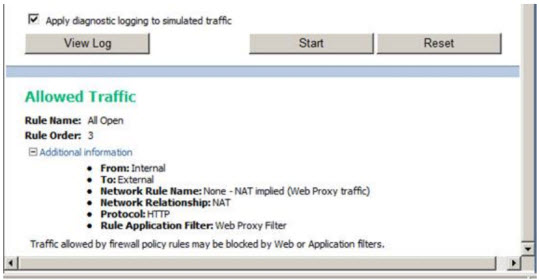
The figure below shows the results of the test after clicking the Start button, accepted data streams, other components .
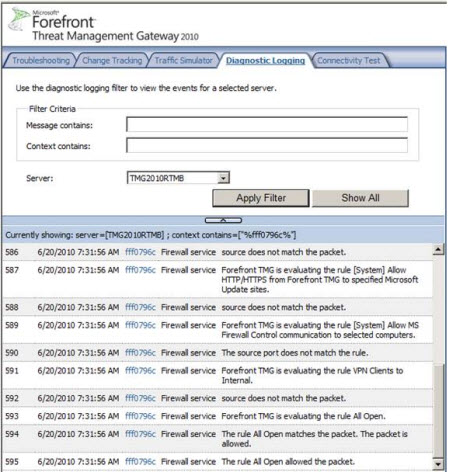
Diagnostic Logging tab
When the user clicks on the View Log button, it will be forwarded to the Diagnostic Logging tab, and will list the details of the diagnostic components for the connection being tested:
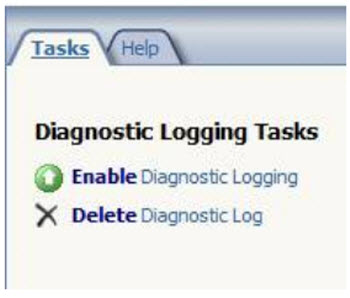
Next, the following figure shows what is in the right pane of the TMG firewall control panel. Here you can enable Diagnostic Logging mode and delete the Diagnostic Log files:
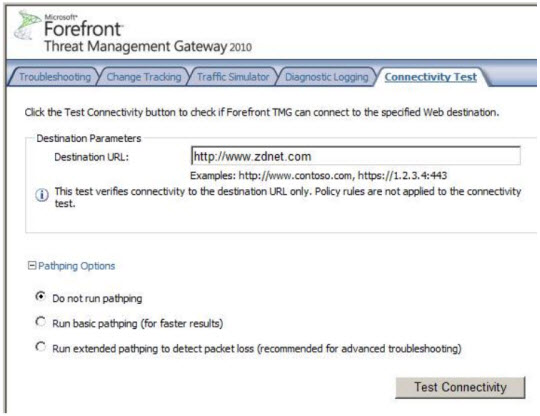
Connectivity Test Card
The final work card to test is here the Connectivity Test. Here, you can perform test connections within the TMG firewall control panel without having to execute outside the control panel and open the command line. The options here include:
- Destination URL: this is the value of the URL to check, and you can also use the FQDN or IP address.
- Do not run pathping: this is the default option, this function only checks HTTP connections
- Run basic pathping (for fast results): select this item to run a short pathping test
- Run đường dẫn mở để tìm thấy đường dẫn gỡ bỏ (recommend để thử việc gỡ bỏ): choose this section if you want to check for lost packets at router devices between the first and last two points.
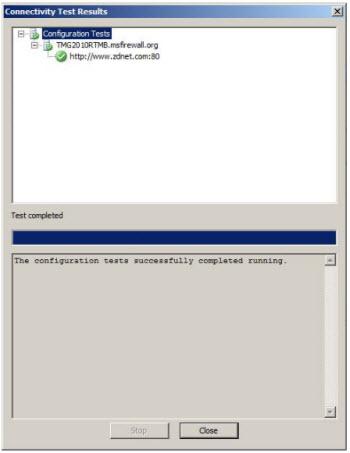
The following figure shows the test results of the HTTP connection, the green circle with the traces indicating that the connection was successful:
generality
Troubleshooting is one of the most important parts in managing and monitoring any network system, and TMG has the tools to make security and security much simpler for administrators. physical. In the previous article, we went over some new features and options in the TMG firewall Troubleshooting section. In addition, there are some features that have been updated to be compatible with ISA Server 2006 application, some new features such as connection testing tools, simulations of data checking and security processes among points in the network system.