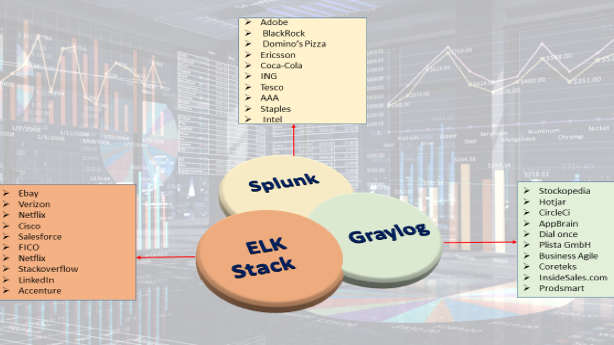
How to Set Up Centralized Log Monitoring with ELK Stack / Graylog / Splunk
How to set up centralized log monitoring with ELK Stack / Graylog / Splunk is a hot topic in the field of system management and information security..
Monitoring, analyzing, and processing logs from multiple sources helps organizations improve incident management, detect security vulnerabilities, and optimize system performance.
Overview of log monitoring tools
What is ELK Stack?
The ELK Stack consists of three main components: Elasticsearch, Logstash, and Kibana. It is a powerful open source toolkit for collecting, analyzing, and visualizing logs. Each component plays an important role in the log monitoring process.
Elasticsearch is a Lucene-based search and analytics engine that allows for fast storage and querying of large data sets. With its good scalability, Elasticsearch is often used for real-time data analysis.
Logstash is a tool used to collect, process, and send logs to Elasticsearch. It can handle many different types of data, including logs from servers, applications, and other data sources.
Kibana is a user interface for Elasticsearch, allowing users to create visual dashboards and reports from data stored in Elasticsearch.
What is Graylog?
Graylog is an open source platform dedicated to log management, providing log collection, analysis, and visualization. It features easy extensibility and alert management features.
One of the strengths of Graylog over the ELK Stack is its data preparation capabilities. Graylog allows users to build pipelines to process logs before they are stored, thereby reducing their size and speeding up queries.
Graylog also provides a friendly, easy-to-use interface that allows users to interact with logs in an intuitive way. This is useful even for those without much technical experience.
What is Splunk?
Splunk is a commercial solution for log collection and analysis. It is known for its powerful capabilities in processing and analyzing big data, especially in enterprise environments.
One of the highlights of Splunk is its ability to automate many log management processes, from collection to analysis and reporting. Splunk also offers many advanced features such as machine learning to detect unusual patterns in data.
Even though it is a commercial solution, Splunk has a large and well-supported user community, which creates many opportunities to learn and get help when needed.
How to Set Up Centralized Log Monitoring with ELK Stack
Install Elasticsearch
The first step in setting up the ELK Stack is to install Elasticsearch. You can install Elasticsearch on your server using a package manager or by downloading the installation file from the official Elasticsearch website.
Once installed, you need to configure Elasticsearch. You can configure the IP address that Elasticsearch will listen on, as well as other parameters like memory size or number of shards.
Install Logstash
Once Elasticsearch is installed, the next step is to install Logstash. Logstash is used to collect and process logs. Users can configure pipelines to collect data from different sources such as log files, application log systems, or network services.
Logstash configuration is very flexible. You can use plugins to connect to many different data sources and perform data processing before sending it to Elasticsearch.
Install Kibana
Kibana is the final component in the ELK Stack. After installing Elasticsearch and Logstash, you need to install Kibana to be able to visualize data. Kibana allows users to create custom dashboards to monitor and analyze log data.
You can start by accessing the IP address or domain name of the server Kibana is running on, then configure indexes to generate visual charts and dashboards for your logs.
How to Set Up Centralized Log Monitoring with Graylog
Install MongoDB
Graylog relies on MongoDB to store configuration information and metadata. The first step in installing Graylog is to install MongoDB. You can download the latest version from the official website and follow the installation instructions.
Once the installation is complete, you need to start the MongoDB service and check if it is working properly.
Install Elasticsearch
Next, you need to install Elasticsearch because Graylog uses Elasticsearch to store logs. Similar to the ELK Stack, you can install Elasticsearch using the package manager or by downloading the installation file.
Once installed, you need to configure Elasticsearch and make sure it is running smoothly.
Install Graylog
Once you have MongoDB and Elasticsearch ready, you can proceed to install Graylog. Download the Graylog installation file from the official website and follow the installation instructions.
Once complete, you will need to configure Graylog to connect to MongoDB and Elasticsearch. This can be done through Graylog's configuration file.
Access to user interface
Finally, once you have Graylog running on your server, you can access the UI via a web browser. From here, you can start creating inputs, dashboards, and setting up notifications to monitor your logs.
How to Set Up Centralized Log Monitoring with Splunk
Install Splunk Enterprise
The first step is to download and install Splunk Enterprise. You can download the free version from the official Splunk website. Once downloaded, simply run the installation file and follow the on-screen instructions.
Once installed, you need to start the Splunk service and log in to the administration interface.
Splunk Configuration
Once you've logged into Splunk, the next step is to configure Splunk to collect logs from a variety of sources. You can add data from log files, applications, and more. Splunk supports a variety of data types and lets you customize how it's collected.
One highlight of Splunk is its 'Data Onboarding' feature, which allows you to easily define and set up data sources.
Data analysis and visualization
Once configured, you can start analyzing and visualizing your log data. Splunk provides powerful tools to help you create custom reports and dashboards.
You can use Splunk's search language to perform complex queries to discover data patterns, and create visual charts and dashboards to monitor system health.
Compare and choose the right tool
Efficiency
The ELK Stack is often praised for its ability to handle big data and fast search thanks to Elasticsearch. However, its performance depends heavily on the configuration and optimization of each component.
Graylog also offers good performance, especially when processing log data before storing it. It can help reduce data size and improve query speed.
Splunk, although a commercial product, is often considered to have superior performance in processing and analyzing big data. Splunk's advanced technologies enable it to process data in real time quickly and efficiently.
Scalability
ELK Stack is highly scalable thanks to Elasticsearch's distributed architecture. Users can easily expand the number of nodes in the cluster to meet the needs of storing and processing large data.
Graylog is also scalable but may not be as flexible as the ELK Stack. However, it still offers plenty of options for scaling operations.
Splunk is highly scalable but can come at a significant cost. If your organization plans to scale significantly in the future, this is something to consider carefully.
Expense
Cost is an important factor when deciding between tools. The ELK Stack is a free and open source solution, but the costs of development, maintenance, and deployment need to be considered.
Graylog is also an open source solution, but there may be costs involved if you need support from the development team.
Splunk is a commercial solution that costs a lot more. However, it offers a lot of powerful features and good support, which can make up for the cost.
Community and support
ELK Stack has a large and vibrant community, with many resources and tutorials available online. This makes learning and troubleshooting easier.
Graylog also has a good community, although not as large as the ELK Stack. However, it still offers helpful documentation and support forums.
Splunk has a large user community and offers professional support. However, getting help can be expensive due to the costs associated with using the product.
Conclude
Choosing the right centralized log monitoring tool for your organization is not a simple task. Each tool such as ELK Stack, Graylog, and Splunk has its own advantages and limitations.
It is important to clearly define your needs and evaluate each tool based on performance, scalability, cost, and community support. This will help you find the best solution to set up centralized log monitoring for your organization.