How to Make 3D Plots Using MATLAB
Whether it's for research, a school assignment, or a work presentation, 3-D plots are great for visualizing what a complicated set of data looks like. With the help of MATLAB (Matrix Laboratory), you'll be able to create stunning 3-D...
Table of Contents
Part 1 of 3:
Constructing the Domain
-
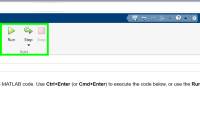
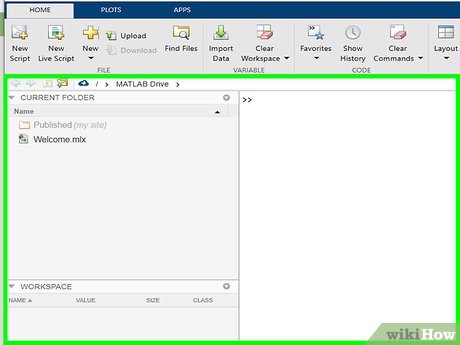 Open the command window. In the default layout this should appear automatically as the biggest window displayed.
 -
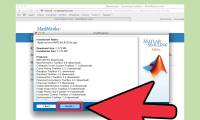
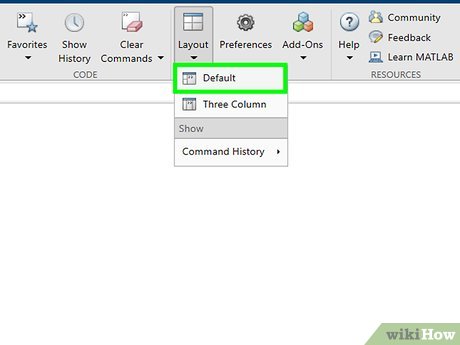 If the command window isn't present, select home in the upper left corner. Afterwards, select layout and then "Default".
 -
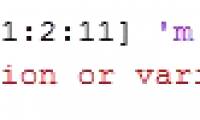
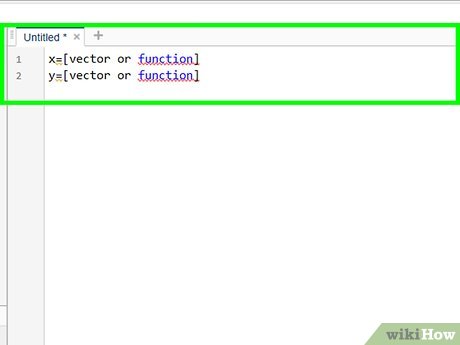 In the command window, define both of your x and y vectors.
- This is typically done in the form of x=[vector or function] and y=[vector or function]
- Remember to use the dot operator when multiplying or dividing vectors and matrices. Otherwise errors will occur.
Part 2 of 3:
Producing the Grid in the xy-Plane
-
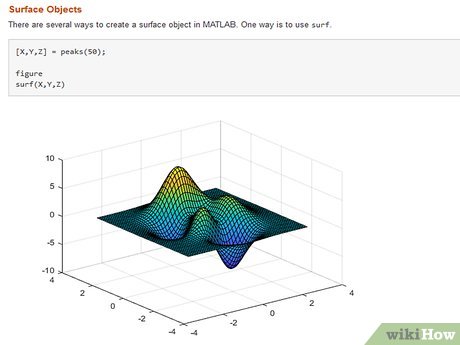
 Define a relationship between x and y. In order to accomplish this, two commands must be used.
- The first is the mesh function. By using this, the result will be a wireframe mesh graph.
- The other is the surf function. When using surf, the result will be a 3-D surface plot.
-
 When using mesh, input meshgrid to the command window.
- The command will be formatted as follows: [xx,yy]=meshgrid(x,y).
- In the workspace window you will see that the variables xx and yy have been defined.
Part 3 of 3:
Defining "zz" and Plotting the Surface
-
 Define zz in terms of xx and yy because of its reliance on those sets of data.
- Use the relationship you know exists between x and y. This is likely to be a function or formula.
- e.g., zz=xx.^2-yy.^2
-
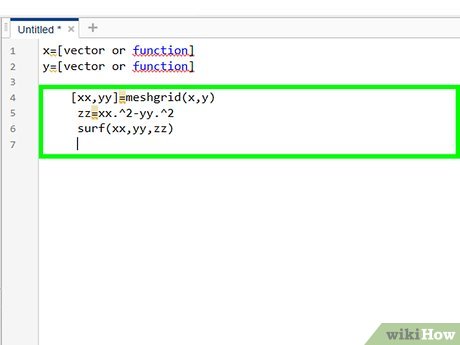 Plot the surface using the surf command.
- From the z components in the matrix "zz", the surf command will create a 3-D shaded surface.
- This is the point in which you will relate xx, yy, and zz together.
- The actual command line will be in the format of surf(xx,yy,zz) .
-
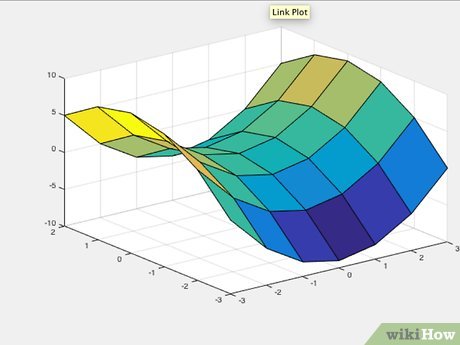 Watch for your new window to appear showing your 3-D plot.
 -
 Customize as you'd like. There is a toolbar at the top of the window where the new plot has appeared. This toolbar contains many options and features that can be used to manipulate your 3-D plot.
- Some of these options include:
- Inserting a label for the x, y, or z axis
- Inserting a legend to help readers
- Rotating the plot in it's 3-D space
- Inserting a light source to show the effects of shadows
- A list of complex surface properties can be found at http://www.mathworks.com/help/matlab/examples/changing-surface-properties.html
- Some of these options include:
-
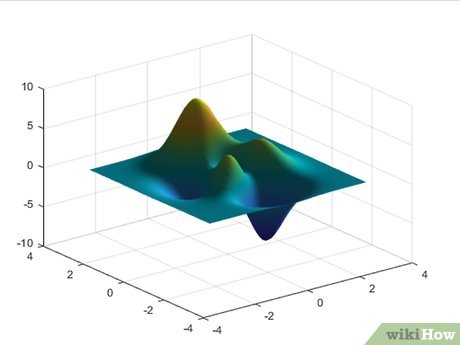 Smooth the color map across the entire surface of the graph, if you'd like. This is done by using the command line shading interp.
Was this article helpful?
Your feedback helps us improve.
Related Articles
 What is a matrix in MATLAB? Commands and usage4 minutes read
 How to Import, Graph, and Label Excel Data in MATLAB5 minutes read
 What is MATLAB?4 minutes read
 How to Download MATLAB on a Mac2 minutes read
 How to Create a Matrix, Vector, and Cell Array in MATLAB5 minutes read
 How to Define, Add, and Subtract Matrices in MATLAB4 minutes read
Reader Comments 0
Sign in with email or Google to join the discussion.