Database monitoring with SQL Profiler
Profiler allows you to manage and capture ongoing activities in your database. Today, we will learn how to use Profiler.
TipsMake.com - SQL Server Profiler is an effective logging tool, included with SQL Server. Profiler allows you to manage and capture ongoing activities in your database, including query adhoc, archive requests, login, errors, . Today, we will Learn how to use Profiler to clarify the above.
Suppose that we have a SOCK named application running on the SOCKsql database, on SwampTest server. If we want to display the T-SQL query that affects the database when a user accesses the SOCK, we will have to:
1. Start SQL Server Profiler and set up the log
2. Run the log while performing the SOCK application login.
3. Stop running the log and check the saved result
Start SQL Server Profiler
You can start SQL Profiler from the Start menu , or in SQL Server Management Studio (SSMS), under the Tools menu. Another way to open SQL Profiler is Start> Run> Profiler . When opened, Profiler will display you the Connect to Server dialog box. Next, you will have to fill in the name of the server you want to create a record, along with confirmation information. Then, click Connect.

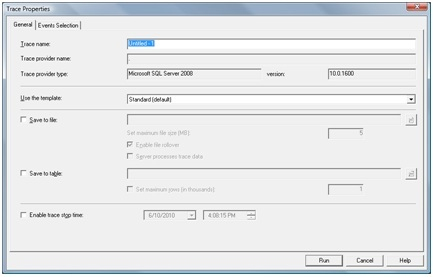
The Trace Properties window will allow you to adjust the record you want. On the General tab , you can enter a Trace name, select a template , choose a save method and turn on the query stop time.

At the Event Selection tab, we select the database event and the properties for each event we want to record. The selected event is part of the standard template we see in the General tab.
Near the left end of the screen, we have 2 small boxes. The ' Show all events ' box displays all the events we can query with Profiler. Take a look at the items in it and then tick it.
Check the ' Show all columns ' dialog box so that we can see all the properties of each event.
• We don't need Audit Login and Audit Logout events today, so there's no need to tick it.
• You will need ' ExistingConnection ', without it, all actions taken by the current connection will not be displayed.
• RPC: Completed - 'Remote Procedure Call: Completed'. The SOCK application almost exclusively uses RPCs, so we'll have to tick it.
• SQL: BatchStarting and SQL: BatchCompleted will display the start and end of the T-SQL command group. You do not have to tick here.
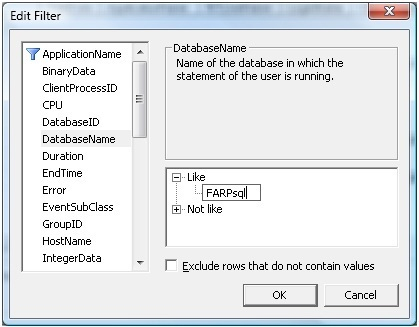
Use column filters to filter the data we don't need. Click Column Filters . In the Edit Filter dialog box, select DatabaseName and then click Like and type the name of your database: SOCKsql . This will ensure Profiler will only record events that occur on the SOCKsql database.

Run the record
In the illustration, only the selected events as well as the time that the record was limited. Therefore, we will not be left with unnecessary information and reduce the load on the server pretty much.
When you're ready to log into SOCK, click Run in SQL Profiler. You will see ' Trace Start ' displayed at the top of the event list in Profiler, followed by a series of current connections.
In the example, we will only record the SOCK login-related events, so as soon as the record is started, we can access the SOCK application. Next, click on the ' stop trace ' red button in SQL Profiler. As such, they already have event log tables.

Read the record
If you want, you can save these events into a file by clicking File > Save As > Trace File , or saving it as a SQL: File > Save As > Trace Table table . For example, we will save this data into an SQL table, which will help you find a word that is in the table easier and faster.
You can now read all recorded events, or search for a keyword or number in any path. When clicking on any line, the data for that row will be displayed at a table at the bottom of Profiler. Note that we have filtered the data by the name of the database, you can check again by dragging to the right of the table to see the name of the selected database.
This short introduction to SQL Profiler can help you record database operations whenever needed.
- Best SNMP monitoring software
- 5 useful network monitoring tools
- 10 best Ping monitoring software and tools
- Use the ALTER DATABASE command to migrate DATABASE in SQL Server
- Top 5 best computer monitoring and monitoring software 2020
- A serious vulnerability on phpMyAdmin allows an attacker to destroy the database


