What you will learn
- Navigate the Processes, Performance, App history, Startup apps, Users and Details views.
- Interpret CPU, memory, disk and network values in context.
- Identify the process behind a visible application or workload.
- End an unresponsive user application safely without terminating essential Windows processes.
What you need
- A Windows PC.
- Several minutes when the computer is idle and again during a normal workload.
- Unsaved work protected before testing an unresponsive application.
Choose the Task Manager view that answers the question
Microsoft lists Task Manager among Windows system configuration tools for monitoring applications, processes, performance and startup behavior. The Processes page is a live workload view; Performance shows longer resource graphs; Startup apps concerns sign-in behavior; Users separates active sessions; Details exposes lower-level process information.
Do not search every tab for the same answer. If the PC feels slow now, begin with Processes and Performance. If sign-in is slow, use Startup apps. If another signed-in user is consuming resources, use Users. Details and Services are advanced views where names are less friendly and mistakes have wider effects.
Create an idle and workload baseline
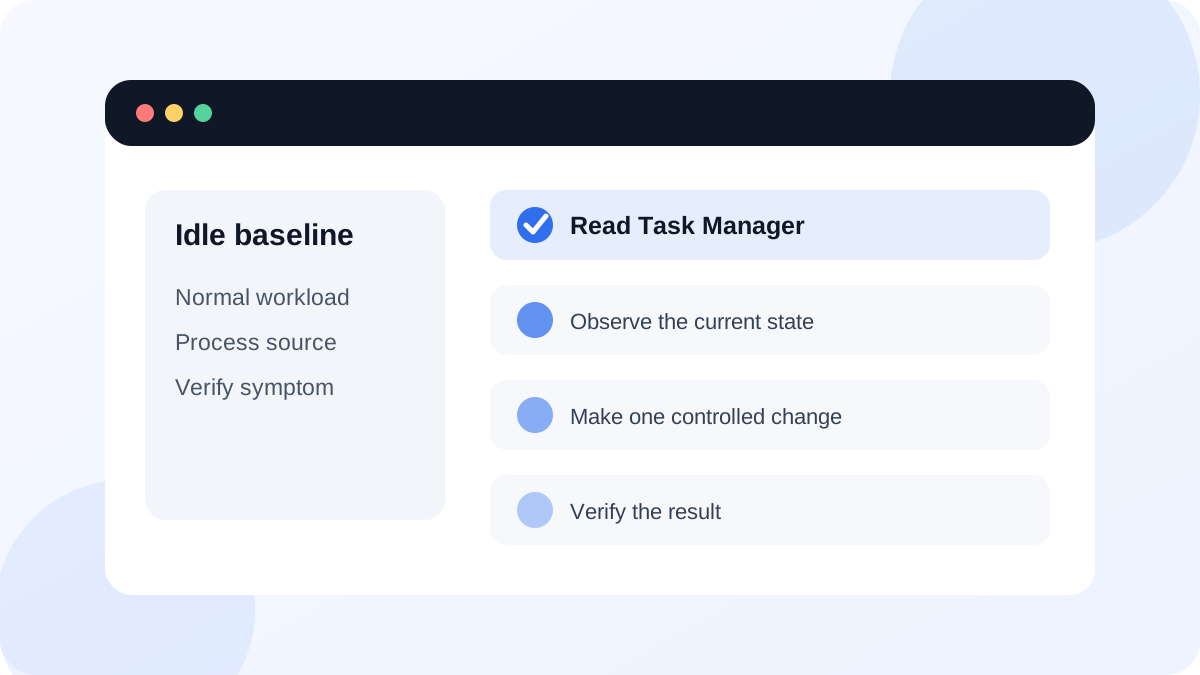
Open Task Manager with Ctrl + Shift + Esc and wait one minute without launching new applications. Record overall CPU, memory and disk use. Then perform the normal task that feels slow—such as opening a project, exporting a file or joining a call—and watch what changes. A brief CPU spike during launch is normal; a sustained bottleneck that matches the symptom is more useful evidence.
Click a column heading to sort descending. Expand an application group to see related child processes. Names such as Service Host can represent Windows services and should not be ended simply because they appear often. Right-click a process and use Search online or Open file location only when you need to identify it; verify the publisher and path.
- 1
Press Ctrl + Shift + Esc.
- 2
On Processes, wait one minute and record overall CPU, Memory and Disk percentages.
- 3
Sort by CPU and note the top process, then repeat for Memory and Disk.
- 4
Run one normal workload and observe which process changes with the symptom.
- 5
Open Performance and note the graph shape rather than only the latest number.
- 6
Save a screenshot or written snapshot with timestamp and workload description.
Interpret common resource patterns
High CPU means the processor is busy; it can come from useful work, updates, browser tabs, compression or a stuck process. High memory means applications are holding a large share of RAM; Windows also uses memory for caching, so the goal is not zero use. Disk at 100 percent indicates the drive is fully busy at that moment, but the transfer rate and response time help distinguish a slow drive from a genuinely large workload. Network use should be tied to an app and expected transfer.
Microsoft's performance guidance recommends checking resource-heavy apps, startup load, updates and storage as part of a broader process. Task Manager identifies correlation; it does not automatically prove the root cause.
- The snapshot includes a timestamp and what the user was doing.
- A high reading persisted long enough to match the symptom rather than appearing as a brief launch spike.
- The process name, publisher or file path was checked before any action.
- Idle and workload measurements are kept separate.
End a task only for a clear user-level failure
If a normal application is unresponsive and work cannot be saved through its interface, select that application and choose End task. This forcibly closes it and can discard unsaved data. Reopen the application and check its recovery feature. Repeated freezing needs application updates, add-on checks, file testing or vendor support—not repeated force-closing as a permanent fix.
Avoid ending Windows processes, security tools, storage services or unfamiliar background components. A process that immediately returns may be managed by a service or scheduled task. Restarting Windows is safer than terminating a chain of system processes when you do not understand their dependencies.
Build a two-state Task Manager snapshot
Compare the PC at idle and during one real workload, then explain which measurement best matches the observed behavior.
- 1
Record idle CPU, memory and disk use after one quiet minute.
- 2
Start one normal workload and record the same measurements.
- 3
Identify the top process in the resource that changed most.
- 4
Open Performance and observe the graph for two minutes.
- 5
Write a one-sentence conclusion that separates evidence from assumptions.
Common mistakes to avoid
- Ending the process with the highest number before understanding its purpose.
- Treating every short CPU or disk spike as a fault.
- Comparing readings taken during different workloads without noting the difference.
- Using Task Manager as proof of malware based only on an unfamiliar process name.
Key takeaways
- Task Manager measures current behavior; context and time turn numbers into evidence.
- Processes, Performance, Startup apps and Users answer different questions.
- End task is a last resort for a stuck user application, not routine system maintenance.
Frequently asked questions
Is 100 percent disk usage always a failing drive?
No. Updates, scans, indexing, paging or file operations can temporarily saturate a drive. Correlate the process, transfer rate, response time, duration and drive-health evidence.
Why does memory stay used after I close an app?
Windows may keep data cached for faster reuse, and background components can remain active. Look at available memory, committed memory and whether the symptom improves—not only one percentage.
Sources and further reading
- System configuration tools in WindowsMicrosoft Support
- Tips to improve PC performance in WindowsMicrosoft Support
Ready to continue?
Mark the lesson complete so your Learning Path progress stays current on this device.