What you will learn
- Define a record and field for the dataset.
- Keep each column to one consistent data type.
- Create unique, meaningful headers.
- Convert a clean range into an Excel table and validate behavior.
What you need
- Excel or a compatible spreadsheet application.
- A small list of at least ten records.
One row should represent one thing
Microsoft describes Excel tables as a way to group and analyze related data with headers, filtering and consistent formatting.
Excel cells can contain text, numbers or formulas, and clean rows and columns enable sorting, filtering and charting.
If a row represents an order, each order belongs on one row. If an order can contain many products, that relationship may need a separate detail table rather than product names packed into one cell. The table design should match the questions you need to answer.
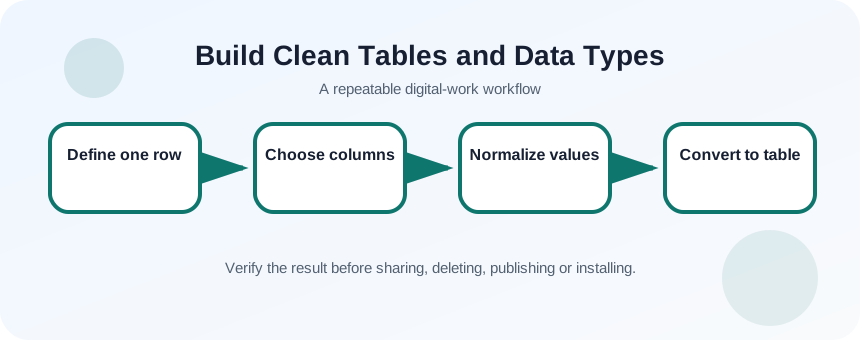
Define the grain and fields
Write a sentence: “Each row represents one…”. Then list the minimum fields required to identify, describe and measure that record. Separate combined values such as Full name or City, State only when the parts must be sorted or analyzed independently.
- 1
State what one row represents.
- 2
Choose a unique identifier.
- 3
List required fields.
- 4
Split values that need separate analysis.
- 5
Choose date, number and text types.
- 6
Remove decorative title rows from the data range.
Normalize and convert the range
Use one header row, no merged cells, and no completely blank rows inside the dataset. Convert numbers stored as text and standardize dates. Preserve leading zeros in identifiers such as postal codes by treating them as text. Then create an Excel table and give it a meaningful name.
- 1
Place headers in the first row.
- 2
Remove duplicate header names.
- 3
Fill or flag missing required values.
- 4
Standardize dates.
- 5
Convert numeric measures to numbers.
- 6
Select the range and choose Format as Table.
- 7
Confirm My table has headers.
Add validation without hiding missing data
Use data validation for controlled categories such as status, region or priority. Avoid replacing unknown values with zero unless zero is a real measurement. Blank, Not applicable and Unknown are different states and may require separate codes.
Calculated columns should use one formula pattern. Structured references in Excel tables can make the formula easier to read and automatically extend it to new rows. Document units in headers, such as Revenue_USD or Duration_minutes, rather than relying on memory.
- 1
Create a dropdown for one category.
- 2
Add units to measure headers.
- 3
Find numbers stored as text.
- 4
Check for duplicate IDs.
- 5
Add one calculated column and inspect its pattern.
Test operations that depend on structure
Sort by a key column, filter one category and add a new row. Confirm that each record stays together, formulas extend and the table range expands. A visually clean table that breaks when sorted is not structurally clean.
- Every row has the same meaning.
- Each column contains one defined data type or documented exceptions.
- Sorting and filtering preserve complete records.
Clean a 12-row contact or order list
Transform a messy range into a reliable Excel table.
- 1
Define the row grain.
- 2
Create unique headers.
- 3
Normalize dates and identifiers.
- 4
Remove blank separator rows.
- 5
Convert to a table.
- 6
Sort, filter and add a test row.
Common mistakes to avoid
- Using merged cells inside the data range.
- Mixing dates, notes and labels in one column.
- Treating identifiers as quantities.
- Using color alone to encode categories.
Key takeaways
- Table quality starts with record definition.
- Consistent data types enable reliable operations.
- Test the table by sorting, filtering and adding rows.
Frequently asked questions
Can a table contain blank cells?
Yes, when values are genuinely missing, but required fields should be validated and the meaning of blank should be defined.
Should I put totals inside the data rows?
Use the Excel Total Row or a separate summary area so totals are not mistaken for normal records.
Sources and further reading
- Create and format tablesMicrosoft Support
- Basic tasks in ExcelMicrosoft Support
Ready to continue?
Mark the lesson complete so your Learning Path progress stays current on this device.