What you will learn
- Capture idle and workload Task Manager readings.
- Interpret sustained CPU, memory, disk and network activity in context.
- Identify the process associated with a symptom without ending system processes blindly.
- Create a measurable performance hypothesis for the next test.
What you need
- A repeatable slow task such as app launch, file copy or export.
- Unsaved work protected before testing.
- Basic familiarity with Task Manager.
Choose the resource question before opening Task Manager
Microsoft describes Task Manager as a system monitor and startup manager that shows performance and resource consumption. It is best used to answer a specific question: what changes when the delay occurs?
Define one user action and time it. Examples include reaching a usable desktop after sign-in, opening a project, copying a known file set or exporting a report. Do not compare an idle screen today with a different workload tomorrow. Keep the power mode, network and foreground task as consistent as practical.
Build an idle and workload snapshot
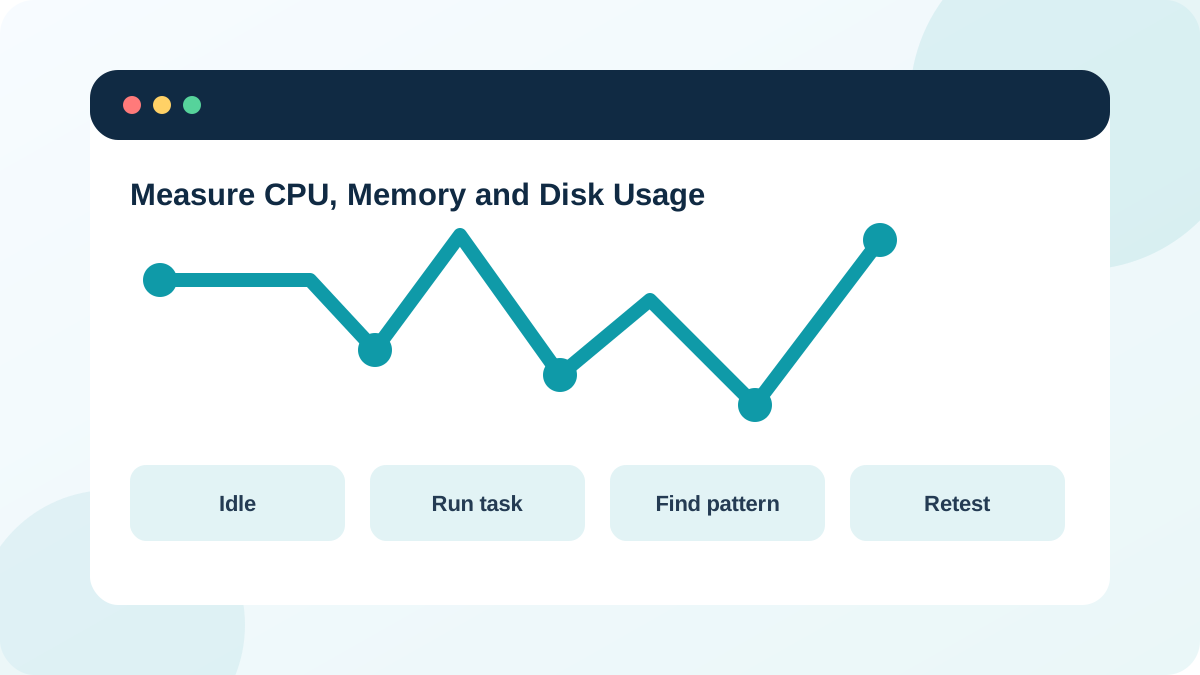
Press Ctrl + Shift + Esc. On Processes, wait one quiet minute and record overall CPU, Memory and Disk values. Sort the relevant column descending and note the top three processes. Then perform the timed task and record the values again at the point of maximum delay. Open Performance to see whether the pressure is a brief spike or sustained pattern.
A launch can legitimately use high CPU for a few seconds. Memory usage can remain high because Windows caches data. Disk can show 100 percent active time at a low transfer rate on a slow or busy drive. Network activity is meaningful only when connected to the app and expected transfer.
- 1
Restart the PC if the test requires a fresh sign-in and wait until the desktop settles.
- 2
Open Task Manager and record idle CPU, Memory and Disk percentages.
- 3
Sort by CPU, then Memory and Disk, noting the top three processes in relevant columns.
- 4
Start the exact slow task and run a timer.
- 5
Record overall use and the process that changes with the delay.
- 6
Open Performance and watch the graph for at least one minute after the task completes.
Interpret patterns without treating a percentage as a verdict
Microsoft's performance guidance combines Task Manager findings with startup apps, available storage, malware checks, updates and hardware capability. A resource reading is one part of a broader diagnosis rather than an automatic repair instruction.
Sustained CPU pressure tied to one application suggests investigating that application's workload, update state or add-ons. High committed memory with low available memory can indicate that the workload exceeds practical RAM capacity or that a process is retaining memory. Sustained disk active time can come from updates, security scans, indexing, paging or a storage problem. Compare duration, response time, transfer rate and process activity before deciding.
- The timed workload is identical before and after a change.
- A sustained pattern, not a brief spike, overlaps the user-visible delay.
- The process name, publisher or file location was checked before action.
- The conclusion uses words such as correlates or suggests unless a controlled test proves cause.
Turn the measurement into one controlled test
If a user application dominates the relevant resource, close it normally and repeat the workload without it. If startup load is high, disable one nonessential startup item and measure the next sign-in. If storage is nearly full, free a known amount of safe temporary space and repeat. Keep a reversal step and change only one important variable.
Ending an unfamiliar process can cause data loss or destabilize Windows. If a normal user application is unresponsive, save work where possible and use End task only as a last resort. Repeated force-closing is not a permanent repair.
- 1
Write one hypothesis based on the measurement.
- 2
Choose a low-risk change that affects only that hypothesis.
- 3
Record how to reverse the change.
- 4
Repeat the same workload twice.
- 5
Compare time and resource readings with the baseline.
- 6
Restore the original state if the result does not improve.
Escalate when the quick measurement cannot explain the symptom
For intermittent or complex performance problems, Microsoft documents Performance Monitor and trace-based tools that can collect data over time. Those tools are appropriate when a short Task Manager snapshot misses the event or when specialist analysis is required.
Escalate with the exact workload, timestamps, baseline, screenshots and changes already tested. This evidence is far more useful than a statement that Task Manager 'looked high.'
Measure one slow task
Use Task Manager and a timer to connect one resource pattern to a real user delay.
- 1
Choose one repeatable task.
- 2
Record idle CPU, memory and disk use.
- 3
Time the task and capture peak readings.
- 4
Identify the process that changes with the delay.
- 5
Write one controlled hypothesis.
- 6
Repeat after one reversible change and compare.
Common mistakes to avoid
- Ending the highest process without identifying its workload.
- Treating one brief spike as a sustained bottleneck.
- Comparing different tasks or different startup states.
- Installing multiple optimizer tools before using built-in measurements.
Key takeaways
- User-visible time and resource behavior must be measured together.
- Task Manager shows correlation; controlled repetition supports causation.
- Change one variable and repeat the same workload.
Frequently asked questions
Is 100 percent disk usage proof that the drive is failing?
No. It can reflect legitimate I/O, paging, updates or scans. Combine duration, transfer rate, process activity, free space and drive-health evidence.
How much memory usage is too high?
There is no universal percentage. Focus on low available memory, heavy paging, sustained slowdown and whether the workload exceeds the device's practical capacity.
Sources and further reading
- System configuration tools in WindowsMicrosoft Support
- Tips to improve PC performance in WindowsMicrosoft Support
- Troubleshoot issues using Performance MonitorMicrosoft Learn
Ready to continue?
Mark the lesson complete so your Learning Path progress stays current on this device.