sample javascript code
-

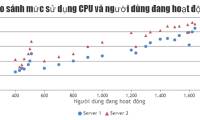
JavaScript code to create a scatter plot with custom markers.
the example below illustrates a multi-series scatter plot created using javascript, where you'll see the markup style for the second series is changed to a triangle. -
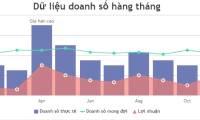
JavaScript code to create a chart/graph combining lines, areas, and columns.
the example below illustrates a combined column, line, and area chart created using javascript. it also contains source code that you can edit in your browser or save to your computer to run locally. -
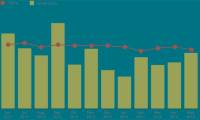
Sample JavaScript code to create a chart with a second axis.
the sample code for the multiple axis chart, generated in javascript, makes it easy to compare series with different ranges within the same chart, instead of flipping back and forth between two charts.