sample javascript code for creating charts
-

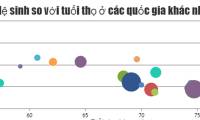
JavaScript code to create bubble charts and graphs.
the example below shows a bubble chart created using javascript, along with the source code that you can edit in your browser or save to your computer to run locally. -
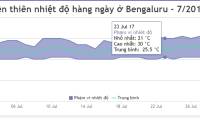
JavaScript code to create a combined area and line chart.
the example below illustrates daily temperature variation along with its average value by combining a range-based and line plot created using javascript.