javascript code to create charts
-

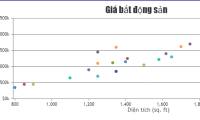
JavaScript code to create a scatter plot/point chart
below is an example of a scatter plot/point chart created using javascript, along with the html source code that you can edit in your browser or save to your computer to run locally. -
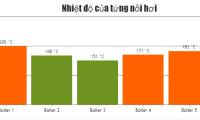
JavaScript code to create dynamic charts/graphs
the example below illustrates a dynamic chart template created with javascript. this javascript sample code for a live data updated chart template.