multi-axis chart code using javascript
-

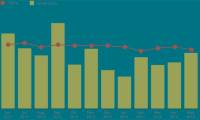
Sample JavaScript code to create a chart with a second axis.
the sample code for the multiple axis chart, generated in javascript, makes it easy to compare series with different ranges within the same chart, instead of flipping back and forth between two charts.